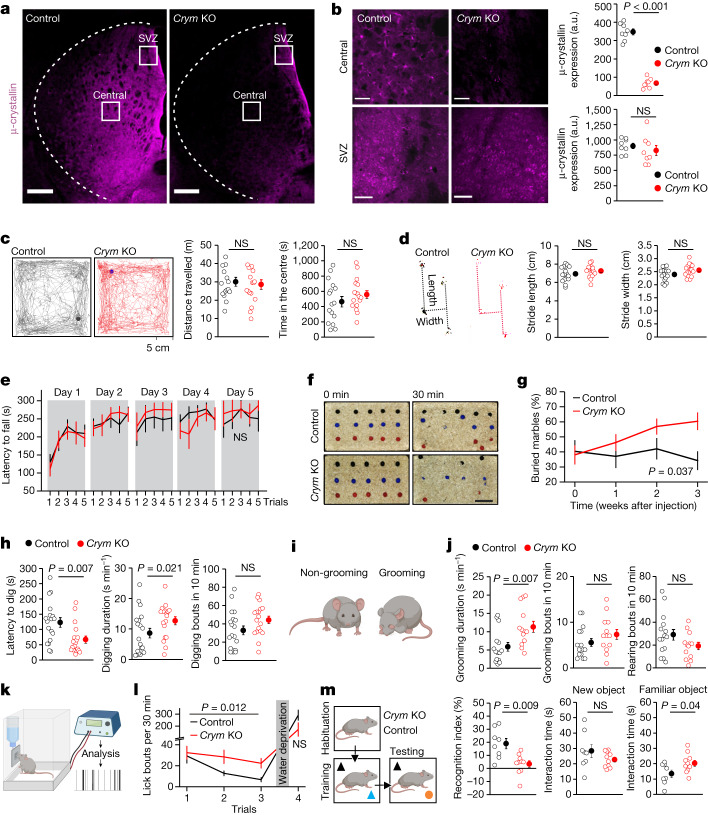
Fig. 2. Deletion of astrocytic Crym in the central striatum induces perseveration.
a, Striatal expression of µ-crystallin in mice injected with control sgRNA-GFP or Crym KO sgRNA-Crym AAVs. Scale bars, 200 μm. b, µ-Crystallin was reduced in the central striatum but not in the SVZ in Crym KO mice (n = 8 mice; two-tailed two-sample t-test; P = 5.3 × 10⁻¹⁰ for µ-crystallin). a.u., arbitrary units. NS, not significant. Scale bars, 50 μm. c, Traces of 30-min open-field recordings for control and Crym KO mice. Graphs of travel distance and time spent in the centre (n = 16 control and n = 17 Crym KO; two-tailed two-sample t-test). d, Footprint tests for control and Crym KO mice (n = 16 control and n = 17 Crym KO; two-tailed two-sample t-test). e, Time on the rotarod (n = 8 mice; two-way repeated-measures ANOVA followed by Tukey’s post-hoc test). f, Marble-burying tests in control and Crym KO mice. Scale bar, 10 cm. g, Buried marbles before and after AAV injection (n = 16 mice; two-way repeated-measures ANOVA followed by Tukey’s post-hoc test). h, Latency to start, total duration and digging bouts over 10 min in control (n = 19) and Crym KO (n = 18) mice (two-tailed Mann–Whitney and two-tailed two-sample t-test). i, Cartoons of self-grooming behaviour: mice disengaged and engaged in self-grooming. j, Self-grooming duration, grooming bouts and rearing bouts in control (n = 15) and Crym KO (n = 13) mice (two-tailed Mann–Whitney and two-tailed two-sample t-test). k, Schematic of the lickometer. l, Lick bouts and the total drinking time over 30 min for each trial (n = 8; two-way ANOVA). m, Evaluations of novel object recognition. Graphs show recognition index (%) and the interaction time with the new and familiar object (n = 8 control and n = 10 Crym KO; two-tailed Mann–Whitney and two-tailed two-sample t-test). Average data shown as mean ± s.e.m. and all statistics reported in Supplementary Table 5.

