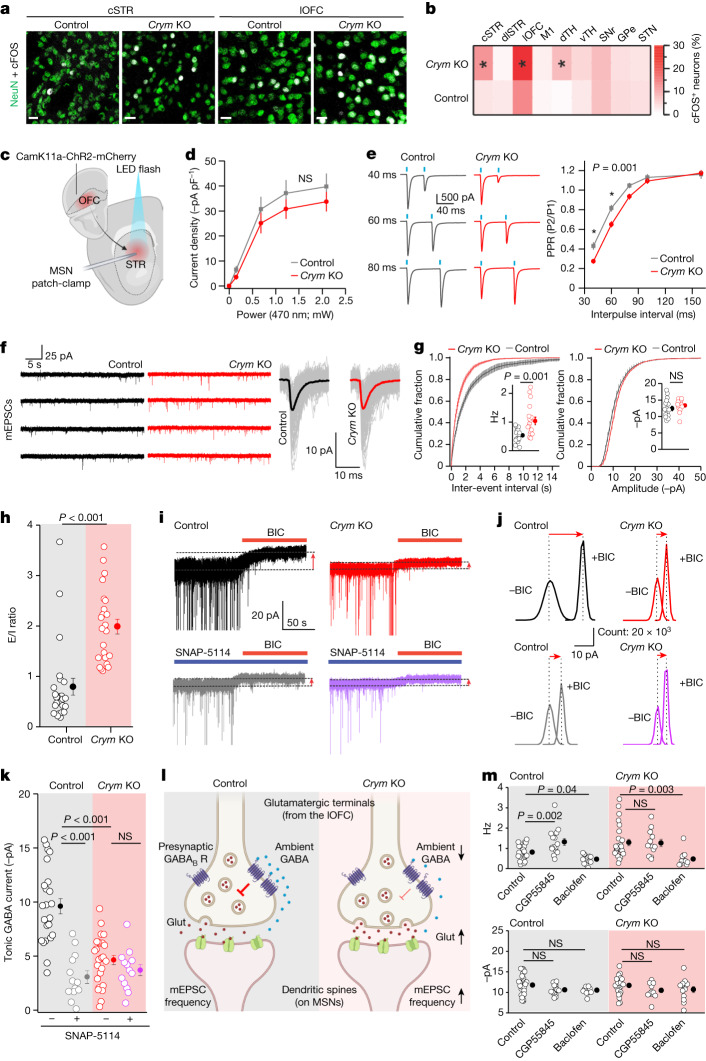
Fig. 3. Astrocytic loss of μ-crystallin alters lOFC–striatum synapses.
a, cFOS and NeuN in the central striatum (cSTR) and lateral orbitofrontal cortex (lOFC). Scale bars, 20 μm. b, Heat map: percentage of cFOS+ neurons. * indicates P < 0.05 (dlSTR, dorsolateral striatum; M1, motor cortex 1; dTH, dorsal thalamus; vTH, ventral thalamus; SNr, substantia nigra reticulate; GPe, globus pallidus external; STN, subthalamic nucleus. SNr and STN, n = 5 mice both groups; lateral and dorsal thalamus and GPe, n = 6 mice both groups; M1 and striatum n = 8 mice both groups, lOFC n = 7 control mice and 8 Crym KO mice; two-sample t-tests and Mann–Whitney test). c, Injection of AAV2-CamK11a-ChR2-mCherry into the lOFC with recordings from the central striatum. d, EPSCs after 2-ms light pulses (n = 18 cells (control) and n = 17 cells (Crym KO) from 5 mice; two-way repeated-measures ANOVA). e, Representative data for evoked EPSCs (n = 17 cells (control) and n = 18 cells (Crym KO) from 5 mice; two-way ANOVA, *P < 0.05). f, mEPSC traces and averages from one representative MSN. g, Cumulative probability graphs for inter-event interval and amplitude; inset shows pooled data (n = 18 cells from 5 mice for both control and Crym KO; two-tailed Mann–Whitney test). h, Excitatory/inhibitory (E/I) ratios (n = 24 cells from 5 mice; two-tailed Mann–Whitney test; P = 1.5 × 10⁻⁶). i,j, Representative data (i) and histograms (j) used to measure tonic GABA currents before and after GAT3 inhibition by SNAP-5114. BIC, bicuculline. k, Tonic GABA currents from experiments such as those in i (control and Crym KO: n = 26 cells from 8 mice; control and Crym KO treated with SNAP-5114: n = 13 cells from 4 mice; two-way ANOVA with Tukey’s post-hoc test, overall ANOVA P = 2 × 10⁻¹¹). l, In control mice, ambient GABA inhibits the release of glutamate (Glut) through the activation of presynaptic GABAB receptors (GABAB R). Crym KO mice show decreased ambient GABA-induced presynaptic inhibition and increased glutamate release. m, mEPSC frequency (top) and amplitude (bottom) before and after treatment with a GABAB antagonist (CGP55845) or agonist (R-baclofen) (n = 12–29 cells from 4 mice; one-way ANOVA with Tukey’s post-hoc test). Average data shown as mean ± s.e.m.

