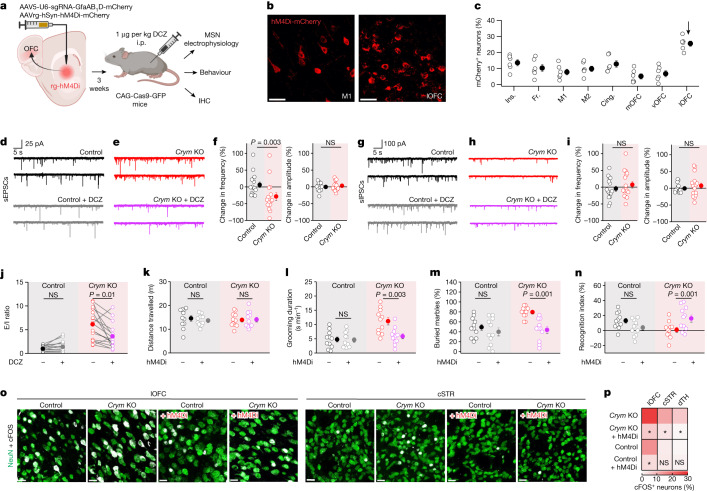
Fig. 4. Presynaptic chemogenetics corrects lOFC–striatum synaptic communication in Crym KO mice.
a, Approach for the co-expression of retrograde (rg) hM4Di-mCherry (or mCherry as control) and sgRNAs against Crym (or against GFP as control). b, Retrograde labelling of neurons in M1 and the lOFC using rg-hM4Di-mCherry. Scale bars, 20 μm. c, hM4Di-mCherry-positive neurons in various parts of the cortex (n = 6 mice). Ins, insular cortex. Fr, frontal cortex. M1, motor cortex 1. M2, motor cortex 2. Cing, cingulate cortex. mOFC, medial orbitofrontal cortex. vOFC, vental orbitofrontal cortex. lOFC, lateral orbitofrontal cortex. d, sEPSC current waveforms from a representative MSN in control mice before (top) and during (bottom) treatment with DCZ (200 nM). e, As in d, but for Crym KO. f, Per cent change in sEPSC frequency (left) or amplitude (right) after DCZ applications for control and Crym KO (n = 16 cells from 4 mice; two-tailed Mann–Whitney or two-tailed 2-sample t-tests). g–i, As in d–f, but for sIPSCs (n = 16 cells from 4 mice; two-tailed Mann–Whitney or two-tailed two-sample t-tests). j, Excitatory/inhibitory (E/I) ratio in control and Crym KO mice before and after DCZ applications (n = 16 paired cells from 4 mice; two-tailed paired-sample t-test; P = 6.6 × 10⁻³ for Crym KO). k–n, Distance travelled in open-field test (k), grooming (l), marble burying (m) and novel object recognition (n) behaviours of control and Crym KO mice without or with rg-hM4Di after treatment with DCZ (n = 11 mice per group; two-way ANOVA followed by Tukey’s post-hoc test). o, cFOS (white) and NeuN (green) expression in the lOFC (left) and the central striatum (right) in control and Crym KO mice without or with rg-hM4Di activation in vivo. Scale bars, 20 μm. p, Percentage of cFOS+ neurons in the four conditions for the lOFC, cSTR and dTH. *P < 0.05 (n = 6 mice; two-way ANOVA followed by Tukey’s post-hoc test, and one-way ANOVA per brain area). Average data shown as mean ± s.e.m. and all statistics reported in Supplementary Table 5.

