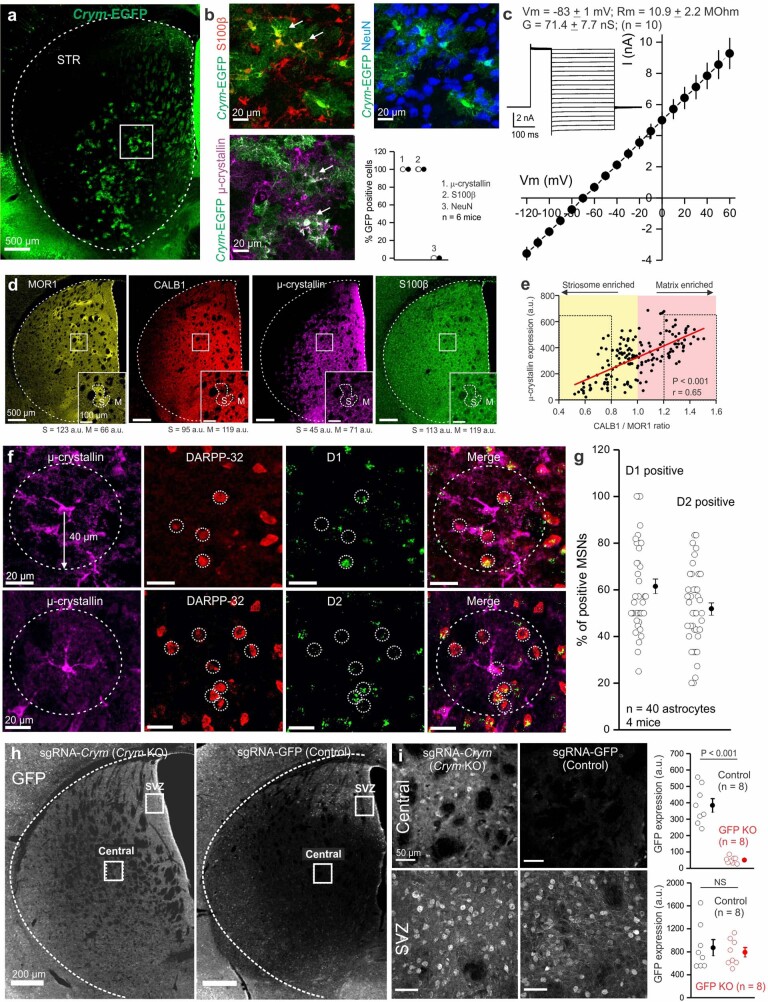
Extended Data Fig. 4. Further characterization of μ-crystallin-positive astrocytes.
a, Whole striatal image of Crym-EGFP BAC transgenic mice show bushy GFP positive cells in the central and ventral striatum. b, Merged images of GFP positive cells (green) with S100β (red), µ-crystallin (magenta), and NeuN (blue). Scatter graph shows the percent of GFP positive cells who are S100β, µ-crystallin or NeuN positive (n = 6 mice). c, Whole-cell voltage clamp performed on GFP positive cells in the central striatum. The waveforms, the current-voltage curve and the membrane properties correspond to astrocyte membrane properties (n = 10 cells from 4 mice). d, Striatal expression of the striosome marker MOR1 (yellow), matrix enriched protein CALB1 (red), µ-crystallin (magenta), and S100β (green). Inset panels show zoomed in images and corresponding intensity values (a.u.) for striosome (S) and Matrix (M) compartments. e, Correlation of µ-crystallin expression and CALB1/MOR1 ratio. A ratio <1 reflects striosome compartment and a ratio > 1 reflects matrix compartment enrichment, respectively. The Pearson correlation coefficient shows a positive correlation (two-tailed Pearson correlation test, r = 0.65; P = 7.6 ×10⁻²¹) with matrix enrichment (161 ROIs from n = 4 mice). μ-crystallin expression levels were 173 ± 22 and 458 ± 15 a.u. in striosome and matrix, respectively (n = 4 mice). f, Representative images of µ-crystallin-positive astrocytes and DARPP-32, D1 (top) or D2 (bottom) mRNA positive MSNs (green). g, D1 and D2 positive MSNs were counted in an area of 80 µm diameter surrounding each µ-crystallin-positive astrocyte. Scatter graph shows the percent of D1 or D2 positive MSNs within a Crym positive astrocyte territory (n = 40 astrocytes from 4 mice). h,i, CRISPR–Cas9-mediated deletion of GFP in the central striatum. h, Whole striatal images show GFP expression in mice injected with control AAV (sgRNA-GFP) or a Crym KO AAV (sgRNA-Crym). i, Images of GFP expression in the central striatum and SVZ. Scatter graphs show that GFP expression was strongly reduced in the central striatum but not changed in the SVZ in GFP KO mice (n = 8 mice, two-tailed Mann–Whitney, P = 9.4 × 10⁻⁴, and two-tailed two-sample t-test). Average data are shown as mean ± s.e.m. and all statistics are reported in Supplementary Table 5.

