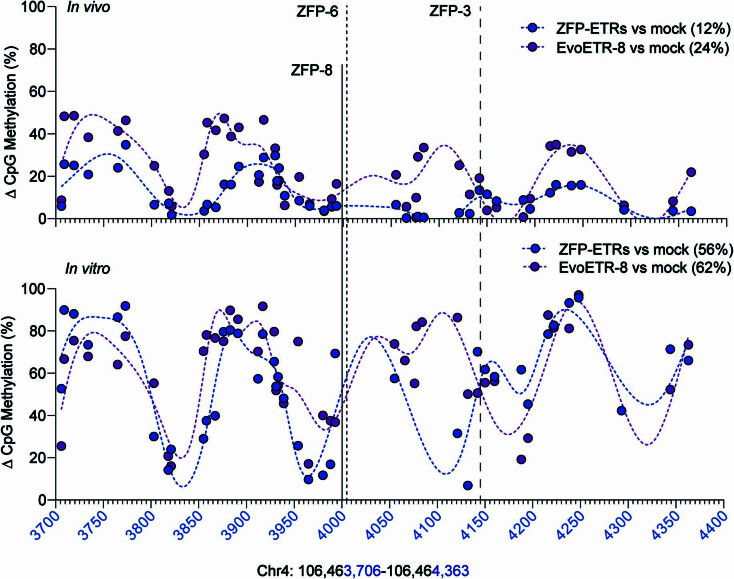
Extended Data Fig. 6. CpG methylation profiles at Pcsk9 in vivo and in vitro.
Dot plots reporting the delta methylation between either ZFP-ETR- or EvoETR-8-treated samples versus untreated controls. Individual dots indicate the average delta methylation of each CpG in the genomic region Chr.4: 106,463,706–106,464,363. Connecting lines were defined as smoothing spline with 20 knots. Mean delta methylation throughout the entire windows for each sample are reported in brackets. Top: replotting of the targeted BS-seq data of Fig. 5e. Bottom: replotting of the WGMS analysis of Fig. 4e,f (for EvoETR-8) and Fig. 2d for ZFP-ETRs. Positions of ZFP-binding sites are indicated as continuous (ZFP-8) or dashed (ZFP-6 and ZFP-3) lines.

