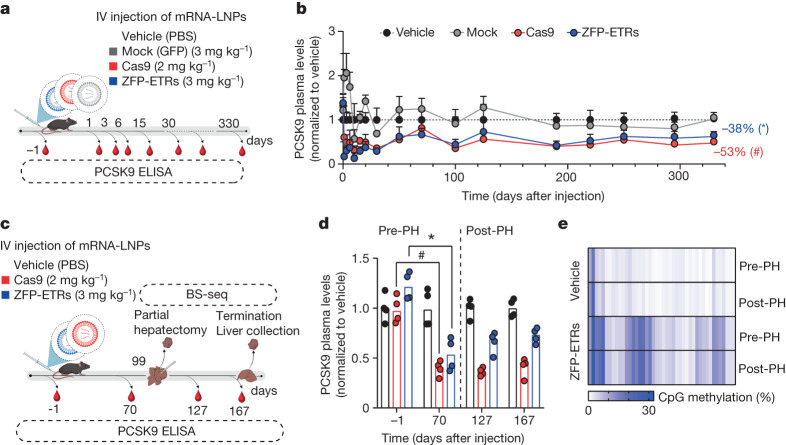
Fig. 3. Durable epigenetic silencing of Pcsk9 in mouse liver after LNP-mediated delivery of ZFP-ETRs.
a, Drawing of the experimental procedure that was used to assess the efficacy and durability of Pcsk9 editing in vivo. LNP D was loaded with mRNAs of ZFP-ETRs, Cas9 or eGFP and injected intravenously (IV). Before and after LNP injection, blood samples were collected to measure the levels of PCSK9 by ELISA. LNP doses are indicated as milligrams per kilogram. Vehicle, PBS-treated mice. Created with BioRender.com. b, Time-course analysis of circulating PCSK9 levels for up to 330 days after LNP injection. Data are mean ± s.d. (n = 7 for ZFP-ETR-treated, 3 for Cas9-treated, 5 for mock-treated and 4 for vehicle-injected mice). Statistical analysis by two-way repeated-measures (RM) ANOVA and Dunnett’s multiple comparisons test between vehicle and the other treatment conditions at the latest time point of analysis (*P = 0.0003 and #P = 0.0272). If not indicated, differences were not statistically significant. c, Drawing of the experimental procedure that was used to assess editing durability after partial hepatectomy. BS-seq, targeted bisulfite sequencing. Created with BioRender.com. d, Bar plot showing the levels of PCSK9 before and after partial hepatectomy (PH). Data for individual mice are normalized to the mean of vehicle-treated mice (dots); bars indicate the median (n = 4 for each experimental group). Statistical analysis by two-way RM ANOVA and Dunnett’s multiple comparisons test was performed among samples belonging to the same treatment (mock, ZFP-ETRs and Cas9) at different times (*P = 0.0148 and #P = 0.0040). If not indicated, differences were not statistically significant. e, Heat map showing the average methylation at single-CpG resolution within the Pcsk9 CGI in treated (ZFP-ETRs) and control (vehicle) samples before and after the partial hepatectomy. Colour intensity refers to the percentage of CpG methylation (mean of n = 4 for each experimental group). Each rectangle represents an individual CpG in the genomic region Chr. 4: 106,463,706–106,464,363.

