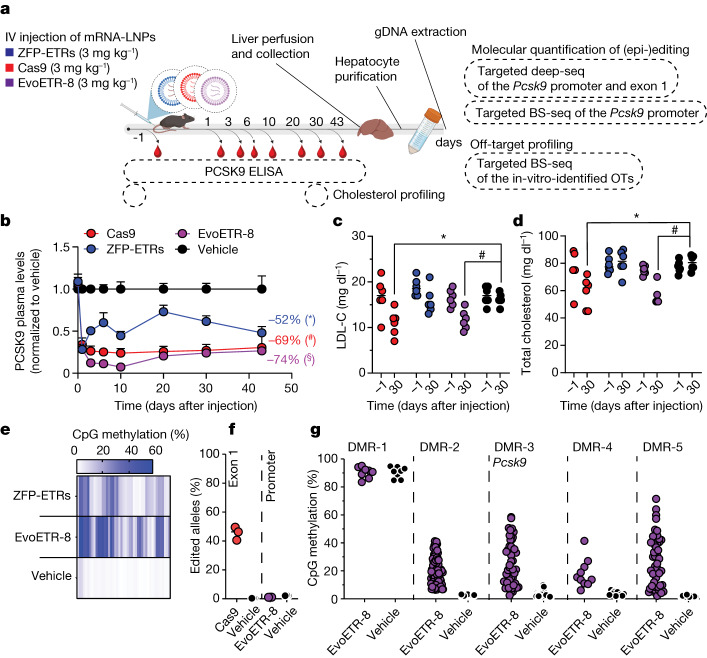
Fig. 5. Improved epi-silencing of Pcsk9 in vivo after LNP-mediated delivery of EvoETR-8.
a, Schematic drawing of the experimental procedures. LNPs were loaded with mRNAs encoding ZFP-ETRs, Cas9 or EvoETR-8 and separately injected intravenously into mice. Vehicle, PBS-treated mice. Before and after LNP injection, blood samples were collected to measure the circulating levels of PCSK9 and cholesterol. Genomic DNA (gDNA) from purified hepatocytes at day 43 after injection was analysed to measure the efficiency of genetic or epigenetic editing at Pcsk9 by targeted deep sequencing (deep-seq) or BS-seq, respectively. DNA methylation levels were also quantified by targeted BS-seq of in-vitro-identified DMRs. OTs: off targets. Created with BioRender.com. b, Time course of the levels of circulating PCSK9 up to 43 days aftr LNP injection. Data are mean ± s.d. (n = 6). Statistical analysis by two-way RM ANOVA and Dunnett’s multiple comparisons test between vehicle and the other treatment conditions at the latest time point (*P = 0.0451, #P = 0.0117 and §P = 0.0118). If not indicated, differences were not statistically significant. c,d, Dot plots showing the levels of LDL-C (c) and total cholesterol (d) in mice 30 days after the treatments (n = 6). Dots represent individual mice; lines represent the median for each group. Statistical analysis by two-way RM ANOVA and Dunnett’s multiple comparisons test (*P = 0.0025 and #P = 0.0090 for LDL-C; *P = 0.0001 and #P < 0.0001 for total cholesterol). If not indicated, differences were not statistically significant. e, Heat map showing the average methylation of single CpGs within the Pcsk9 CGI of treated (ZFP-ETRs and EvoETR-8) and control (vehicle) mice. Colour intensity refers to the percentage of methylation (n = 3). Each rectangle represents an individual CpG in the genomic region Chr. 4: 106,463,706–106,464,363. f, Dot plot showing the percentage of edited alleles. Data are reported as percentages of individual mice (dots) and medians (lines). The percentage of edited alleles was measured in Pcsk9 exon 1 for Cas9- and vehicle-treated mice, and in the Pcsk9 promoter for EvoETR-8- and vehicle-treated mice (n = 3). g, Dot plots showing the percentage of in vivo methylation in EvoETR-8- and vehicle-treated mice by targeted BS-seq. Five genomic sites were interrogated, corresponding to the five DMRs that were identified in vitro from the comparison EvoETR-8 versus mock. Each dot represents a single CpG in the indicated DMR (mean of n = 3). The plot showing the Pcsk9-associated DMR (DMR-3) is a reanalysis of the data in e and was included here as reference for on-target methylation.

