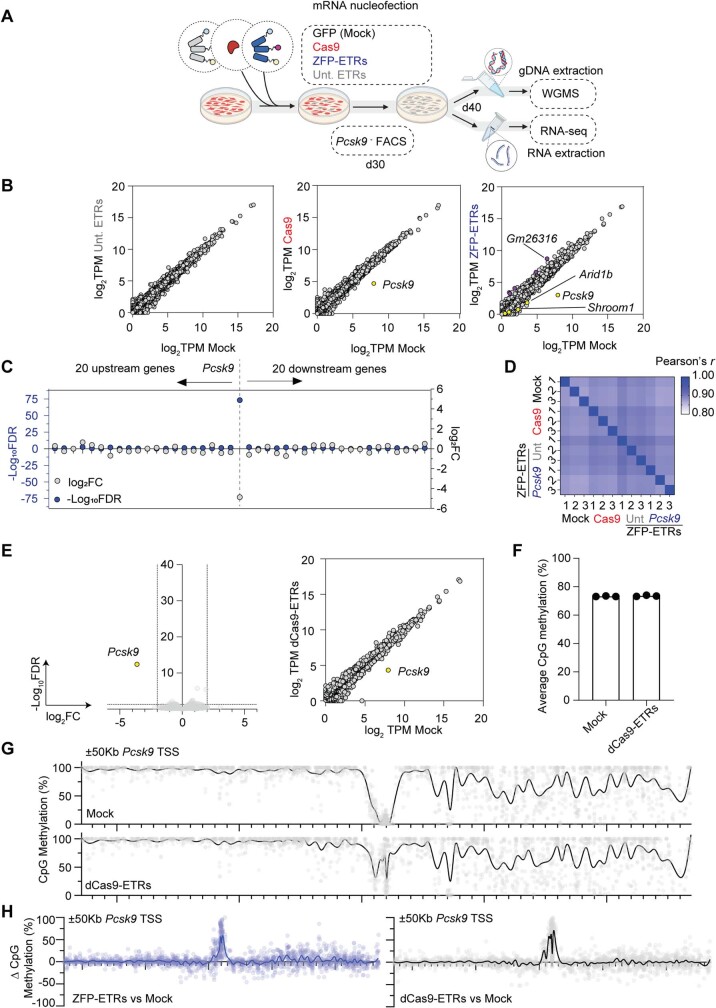
Extended Data Fig. 2. Specificity assessment of ZFP- and dCas9-based ETRs.
a, Schematic drawing showing experimental procedures for in vitro specificity profile of ETRs. Created with BioRender.com. b, Scatter plots from RNA-seq analyses comparing the gene expression levels between mock and either untargeted ETRs (Unt. ETRs; left), Cas9 (middle) or ZFP-ETR (right) treated cells. Purple and yellow dots indicate genes significantly up- and downregulated, respectively; grey dots indicate genes considered not differentially expressed. Thresholds were set at FDR ≤ 0.05 and |log2FC| ≥ 2. Data are expressed as log2 of transcript count per million (TPM) of mapped reads. c, Differential gene expression analysis of 20 genes either up- or downstream of Pcsk9 from RNA-seq analysis. d, Heat map of Pearson’s correlation among WGMS replicates calculated using the cor function after filtering by the coverage, normalizing and considering the positions shared by all the replicates in each condition. Values are reported for each replicate (1, 2 and 3) in each condition. e, Volcano plot (right) and scatter plot (left) from RNA-seq analyses showing differential gene expression between mock and dCas9-ETR-treated cells (n = 3). Yellow dots indicate genes significantly downregulated; grey dots indicate genes considered not differentially expressed. Thresholds were set at FDR ≤ 0.05 and |log2FC| ≥ 2. For the scatter plot, data are expressed as log2 of transcript count per million (TPM) of mapped reads. f, Bar plot showing the genome-wide levels of CpG methylation of the indicated samples as calculated from the WGMS analyses (n = 3 technical replicates). g, Manhattan plot from WGMS showing the CpG methylation profiles of the indicated samples in a ±50-kb genomic region centred on the TSS of Pcks9. Individual dots indicate the average methylation of each CpG. Connecting lines were defined as smoothing spline with 100 knots. h, Manhattan plot from WGMS showing differential methylation of CpGs in a ±50-kb genomic region centred on the TSS of Pcks9 between the indicated samples and mock-treated cells. Individual dots show the differential methylation between the indicated samples at each CpG site. Connecting lines were defined as smoothing spline with 100 knots.

