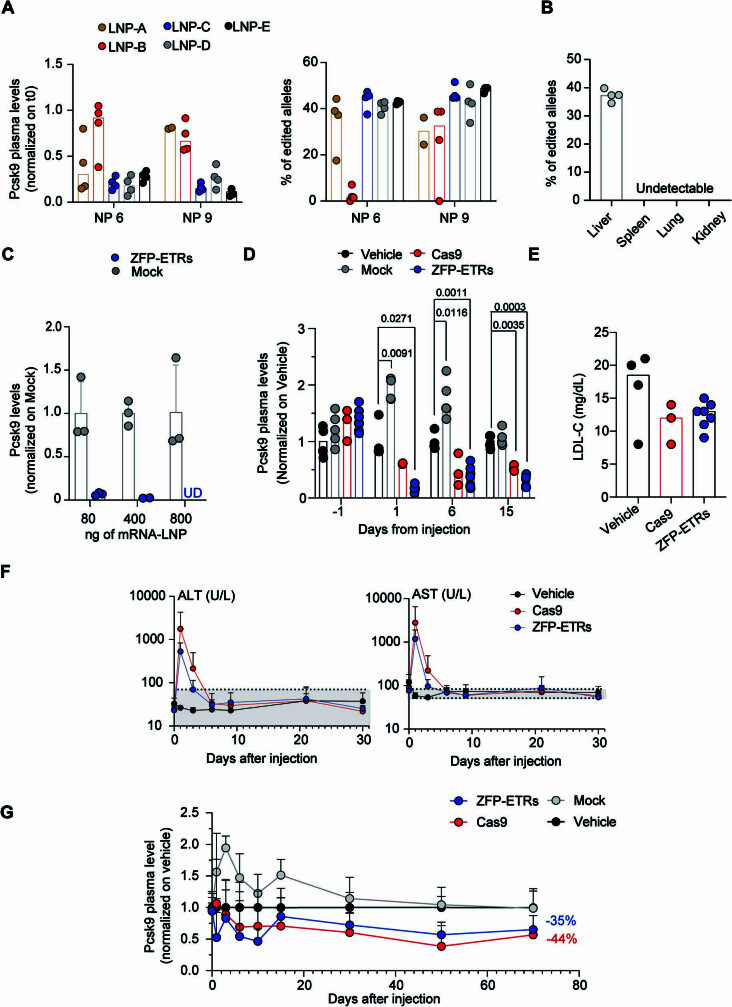
Extended Data Fig. 3. Editing of Pcsk9 in mice.
a, Bar plots showing the circulating levels of Pcsk9 (left) and percentage of edited alleles (right) at day 7 post-injection of the indicated LNP formulations encapsulated with Cas9-encoding mRNA and a sgRNA targeting the first exon of Pcsk9 (n = 4 for each group). Treatments with LNP A (NP ratio 9) and LNP-E (NP ratio 9) resulted in 2 and 1 death, respectively. Dots: data from individual mice normalized to pre-treatment levels. Bars: median for each group. b, Bar plot showing the percentage of Pcsk9 edited alleles from different organs of mice treated with LNP D (NP ratio 6) encapsulated with Cas9-encoding mRNA and a sgRNA targeting the first exon of Pcsk9. Dots: data from individual mice (n = 4). Bars: median for each group. c, Bar plot showing levels of Pcsk9 in the supernatants of mouse hepatocytes after transfection of three different doses of mRNAs encoding for either ZFP-ETRs or eGFP (mock). Pcsk9 levels for each replicate and each group were normalized to the mean of the mock at the same dose. Data from individual replicates are reported as dots; bars indicate average values (n = 3, mean ± s.d.). UD: undetectable. d, Bar plot showing the levels of Pcsk9 in the plasma of mice treated as indicated in Fig. 3a,b of the main text. Data for individual mice (dots) are reported as normalized to the mean of vehicle-treated mice. Bars indicate the median for any conditions. Data are reported as mean ± s.d. (n = 7 for ZFP-ETR-, 3 for Cas9-, 5 for mock- and 4 for vehicle-injected mice).Statistical analysis by two-way RM ANOVA and Dunnett’s multiple comparisons test between vehicle and the other treatment conditions at the lates time point of analysis; P values are reported in the figure. If not indicated, differences were not statistically significant. e, Bar plots showing the circulating levels of LDL-C in mice 30 days after the indicated treatments (n = 7 for ZFP-ETR-, 3 for Cas9-, 5 for mock- and 4 for vehicle-injected mice). Dots: individual mice. Bars: median level for each group. f, Time course of transaminases (ALT and AST) until day 30 post-treatment. Data are reported as the mean ± s.d. of U/L of plasma (n = 6 for any groups). Grey area indicates physiological levels. g, Time course of circulating Pcsk9 until day 70 post-treatment. Data are reported as the mean ± s.d. and normalized to PCSK9 levels in vehicle-treated mice (n = 22 for ETR-, 7 for Cas9-, 16 for mock- and 15 for vehicle-injected mice).

