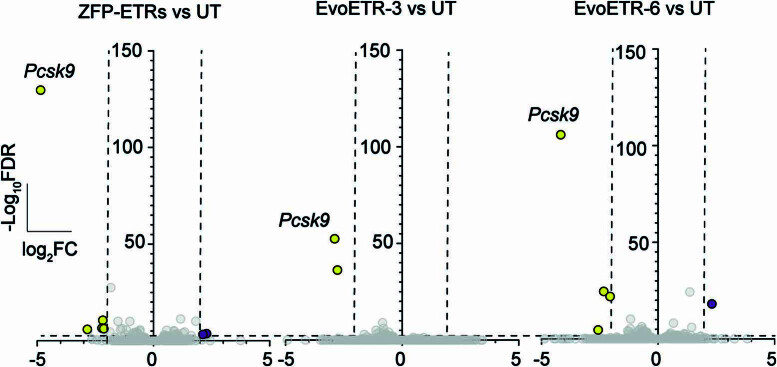
Extended Data Fig. 4. In vitro characterization of the specificity of EvoETRs.
Volcano plots from RNA-seq analyses showing differential gene expression between the indicated ETR-treated samples and untreated cells (n = 2). Purple and yellow dots indicate genes significantly up- and downregulated, respectively; grey dots indicate genes considered not differentially expressed. Thresholds were set at FDR ≤ 0.05 and |log2FC| ≥ 2 and are indicated in the graphs as dashed lines.

