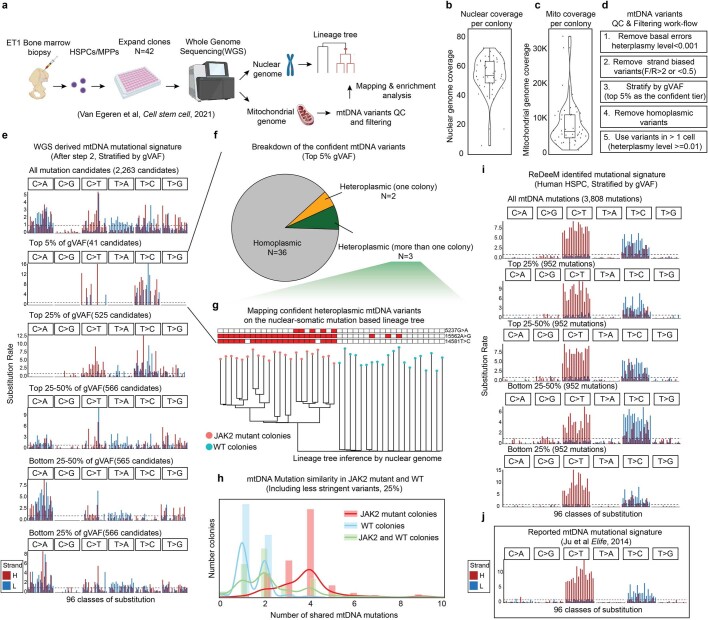
Extended Data Fig. 6. Mitochondrial mutation analysis in single colony WGS data.
a, Schematic of the experimental design and reanalysis strategy. b-c, Single colony WGS data quality control. Sequencing coverage on nuclear genome in b, and on mitochondrial genomes in c are shown. Each dot represents one colony. n = 42 colonies. Boxplots display data from the 25th to 75th percentile, and whiskers extending to the minimum and maximum within 1.5 IQR. d, Mitochondrial mutation calling and quality control pipeline for WGS data. e, Mutational signatures in each class of mononucleotide and trinucleotide change by the heavy (H) and light (L) strands. The mtDNA mutations are after step 2 from d and stratified by global VAF (gVAF). n = 2,263 all mutation candidates. f, Categories of the top 5% confident mtDNA mutations. The pie chart shows the proportions of homoplasmic mutations (or appear in all colonies), singular heteroplasmic mutations (or appear only in one colony) as well as heteroplasmic mutations (or appear in a subset of colonies). g, Direct mapping for confident heteroplasmic mtDNA mutations onto the nuclear genome inferred tree. h, mtDNA Mutation similarity (# of shared mutations) within JAK2 mutant clones; within WT clones; or between JAK2 mutant clones and WT clones. I, Mutational signatures for mtDNA mutations identified by ReDeeM in Young-1 HSPC dataset, stratified by gVAF. j, Expected true mtDNA mutational signature. Also see Supplementary Notes.

