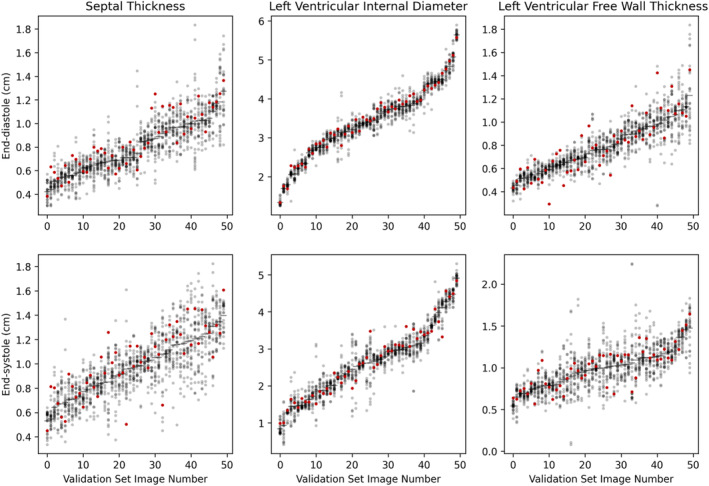
FIGURE 5.

Relationship of AI value (red) to the 26 expert values (gray), for each of 50 end‐systolic and 50 end‐diastolic frames. The frames are arranged by the consensus measurement, with the smallest first. The 3 panels display IVS, LVD and FW, respectively.
