
FIGURE 2.
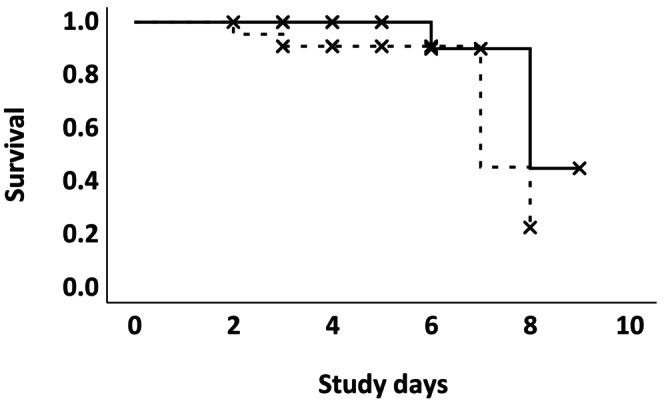
Kaplan‐Meier Curve comparing survival between the EACA (dotted line) and HC (solid line) groups. X indicate censored events. P‐value = .15.
Official websites use .gov
A
.gov website belongs to an official
government organization in the United States.
Secure .gov websites use HTTPS
A lock (
) or https:// means you've safely
connected to the .gov website. Share sensitive
information only on official, secure websites.
Kaplan‐Meier Curve comparing survival between the EACA (dotted line) and HC (solid line) groups. X indicate censored events. P‐value = .15.