
Figure 5.
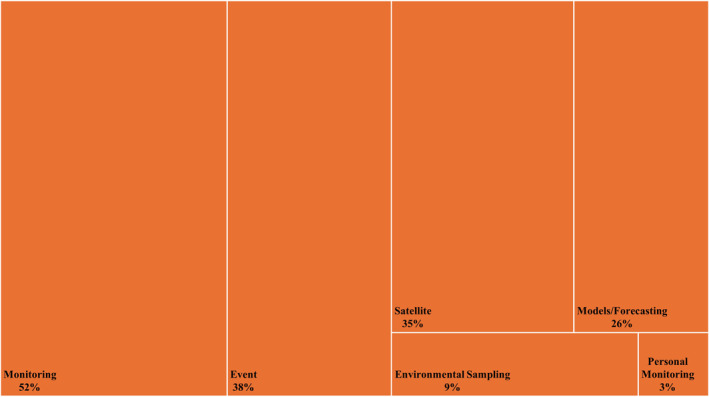
Exposure data sources (n = 77 articles). The size of each rectangle is proportional to the number of articles represented in each category. Articles used one or more exposure data sources. Article counts and percentages are shown in Table S5 in Supporting Information S1.