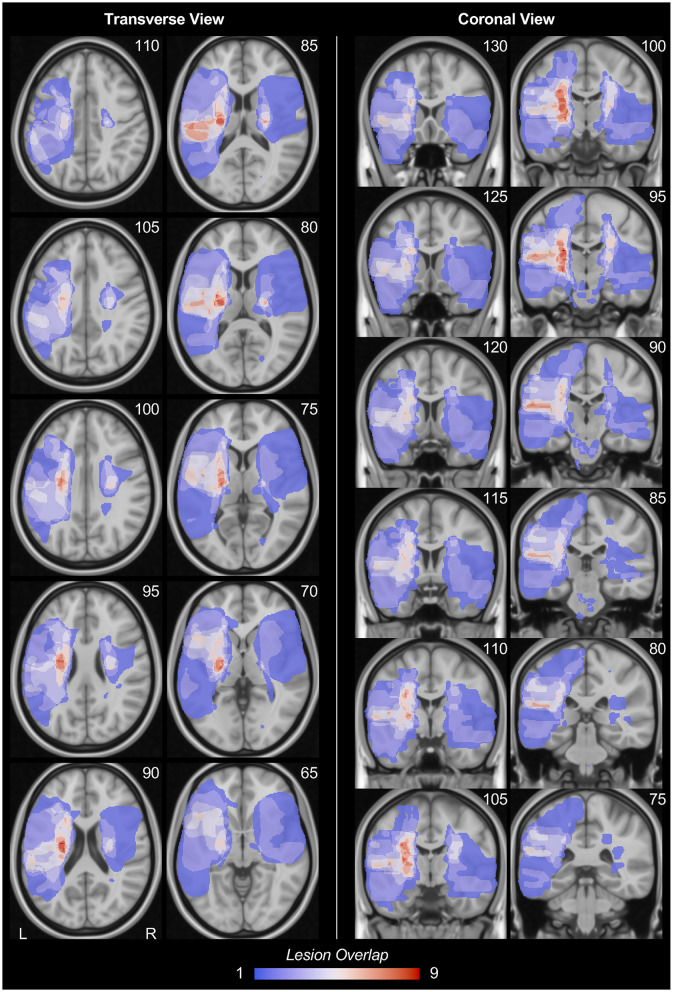
Figure 1.
Stroke lesion overlap. The stroke lesion overlap maps were respectively displayed in the transverse view and coronal view in MNI152 space. Note that, for this lesion overlap map, all lesion masks were on their original hemisphere. The number at the upper-right corner of each figure indicates the slice coordinates. L, left hemisphere; R, right hemisphere.

