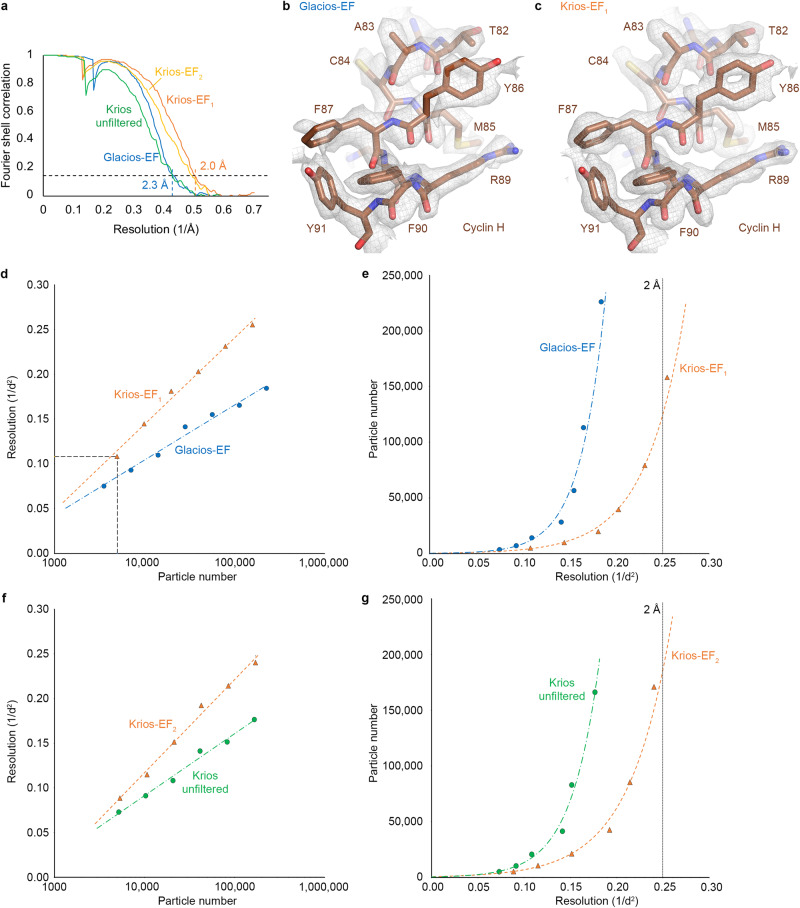
Fig. 3. Glacios vs. Krios resolution comparison and impact of energy filtration on the resolution obtained.
a FSC curves for the Glacios and Krios cryo-EM reconstructions (EF = energy filtered). Comparison between cryo-EM maps from Glacios-EF (b) and Krios-EF1 (c) data. A segment of cyclin H is shown as an example. d Henderson-Rosenthal plot comparing Krios-EF1 and Glacios-EF data. The inverse squared resolution of data subsets is plotted against the logarithm of the particle number, resulting in a linear relationship. e Particle number plotted against inverse squared resolution. It is apparent that the Glacios data may not cross the 2 Å line even for very large amounts of data. f, g As d and e, but comparing the reconstructions obtained from the energy-filtered Krios setup (dataset Krios-EF2) against the results obtained after retracting the slit from the beam path (Krios unfiltered). Source data are provided as a Source Data file.

