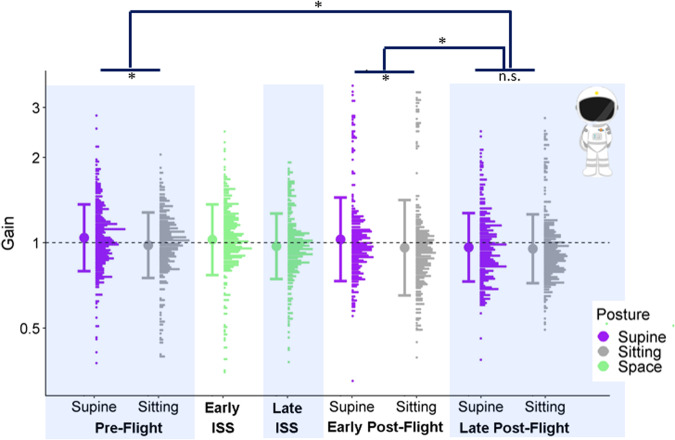
Fig. 2. Accuracy data for astronauts.
Full distributions of the astronauts’ gains for the different test sessions and postures were generated at a bin width of 0.0175 and plotted on a log scale. The postures are color-coded (purple for supine, gray for sitting, and green for in-space sessions). The bold dot to the left of each distribution indicates the mean across all participants for the corresponding test session and posture, and the bars correspond to ±1 standard deviation. Asterisks indicate significant differences in the means at a significance level of 0.05.

