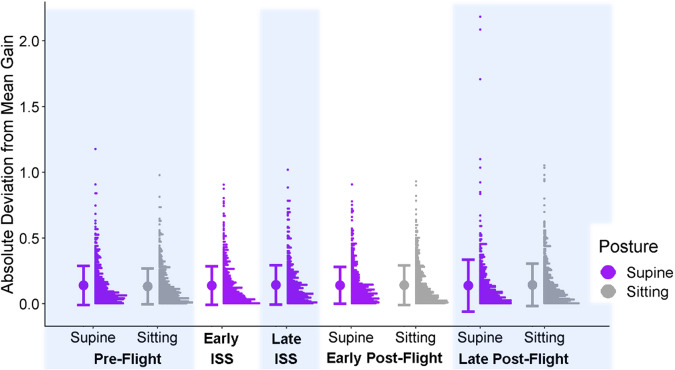
Fig. 5. Precision data for controls.
Full distributions of the controls’ absolute deviations from the mean gain for the different test sessions and postures were generated at a bin width of 0.075. The postures are color-coded (purple for supine and gray for sitting). For the control participants, the “ISS” sessions were completed on Earth in the supine position. The bold dot to the left of each distribution indicates the mean across all participants for the corresponding test session and posture, and the bars correspond to ±1 standard deviation.

