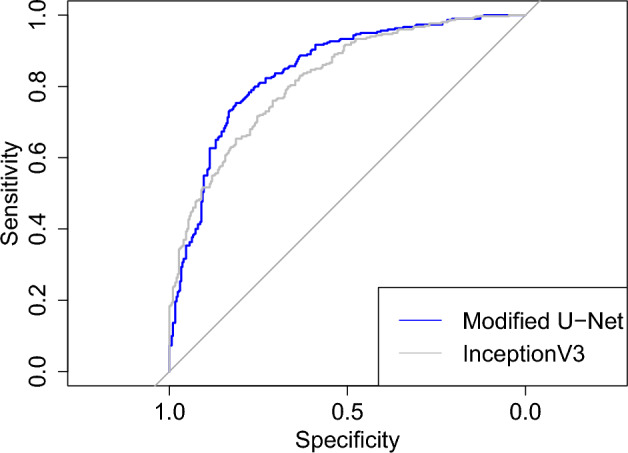
Figure 1.

ROC curves computed from the binary predictions of a test set containing 300 chest X-rays with COVID-19 and 300 X-rays from healthy patients by the modified U-Net (in blue) and InceptionV3 (in gray), accompanied by a straight line equal to the theoretic ROC curve of a random binary classifier. The x-axis here uses sensitivity instead of the false positive rate but, since its values range from 1 to 0, the end result is a typical plot, not its reflection. The AUC values are 0.845 for the modified U-Net and 0.821 for InceptionV3. The values of other evaluation metrics are in Table 4.
