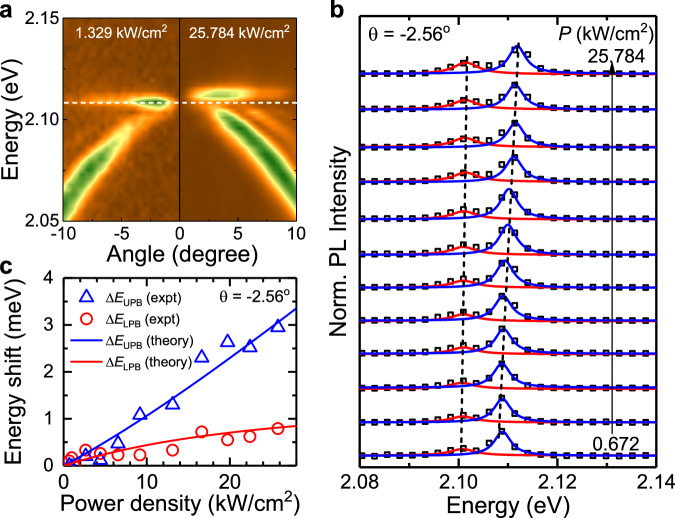
Fig. 4. Tuning of strong coupling by excitation power.
a Angle-resolved PL spectra acquired under different excitation power: ~1.329 kW/cm2 (left) and ~25.784 kW/cm2 (right) showing the blueshifts of both polariton branches with increasing power. The white dashed line is guideline. b Normalised PL spectra extracted at −2.56° under varying excitation power density from 0.672 kW/cm2 (bottom) to 25.784 kW/cm2 (top), which induces changes in detuning energy and energy splitting. All spectra are fitted by double Lorentzian, and the constituents are shown by red and blue solid lines for LPB and UPB, respectively. c Energy shift of UPB (, blue triangles) and LPB (, red circles) relative to the lowest used power. Theoretical fitting curves are shown by solid lines considering the power-induced energy shift of the uncoupled SPE and BIC modes.

