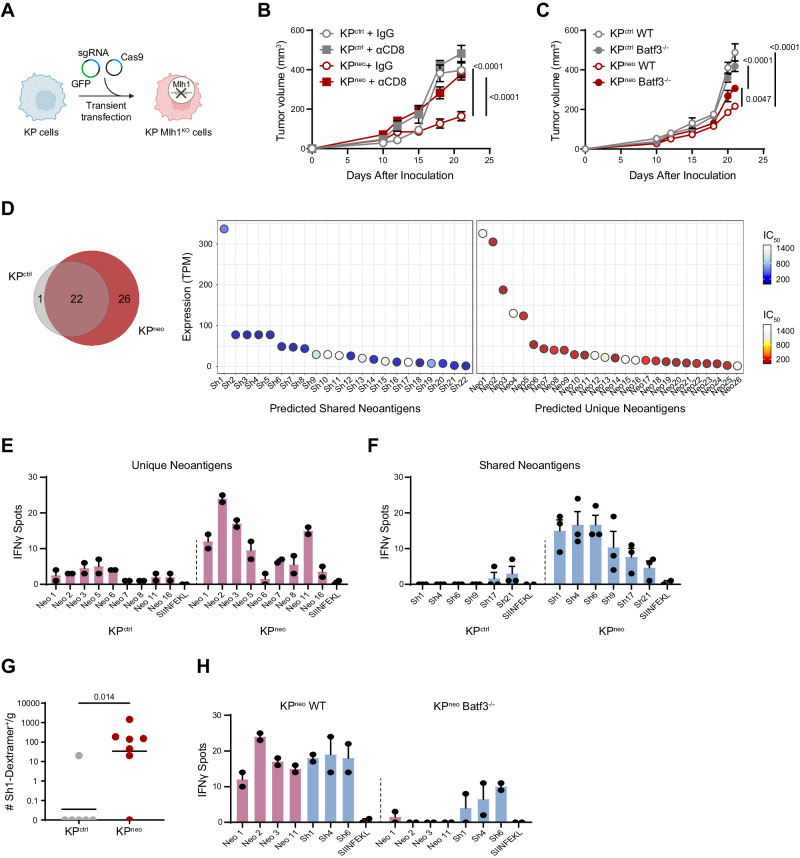
Fig. 1. Increasing neoAgs in KP drives cDC1-dependent anti-tumoral responses to neoAgs.
A KP cells were transiently transfected with CAS9 and sgRNA targeting the Mlh1 locus to generate Mlh1-deficient cells, or CAS9 alone (KPctrl) (Created with BioRender.com). B, C 5 × 10⁵ KPctrl or KPneo tumor cells were implanted subcutaneously, and tumor outgrowth was measured at the indicated time points. B Mice were treated with anti-CD8 antibodies or isotype control (IgG) (n = 5, data are from one out of the two independent experiments). C Tumor cells were implanted into wild-type or Batf3−/− (n = 6, data are from one out of two independent experiments). D The Venn diagram represents the number of shared and unique neoantigens expressed at mRNA level in KPctrl and KPneo cells. neoAgs commonly expressed in KPctrl and KPneo (shared, sh) and neoAgs expressed de-novo in KPneo (unique, neo) are plotted according to expression levels (TPM) and affinity for MHC class-I (IC50). E, F At day 12 after challenge, splenic CD8 T from KPctrl or KPneo tumor-bearing mice were restimulated with selected unique (E) or shared (F) individual neoAgs and tested for IFN-g by ELISpot. Individual dots are technical replicates from one representative experiment (pooled CD8 T cells from 3 mice), out of three performed. G KPctrl or KPneo tumor tissues were harvested at day 26 and labeled with sh1 MHC class I-specific dextramers to identify neoAg-specific CD8+ T cells. Data from 1 experiment with 6 animals for KPctrl and 7 animals for KPneo group. H) Wild type or Batf3−/− mice were challenged with KPneo tumors. At day 12, CD8 T cells were isolated from the spleen to test reactivity against selected shared and unique peptides by IFN-γ ELISpot. Individual dots are technical replicates from one representative experiment (pooled CD8 T cells from 3 mice), out of three performed. Two-way ANOVA followed by Sidak’s post-test in (B), or Tukey’s post-test in C, two-tailed Mann-Whitney U test in (G). All data are plotted as mean ± SEM. Source data are provided as a Source Data File.

