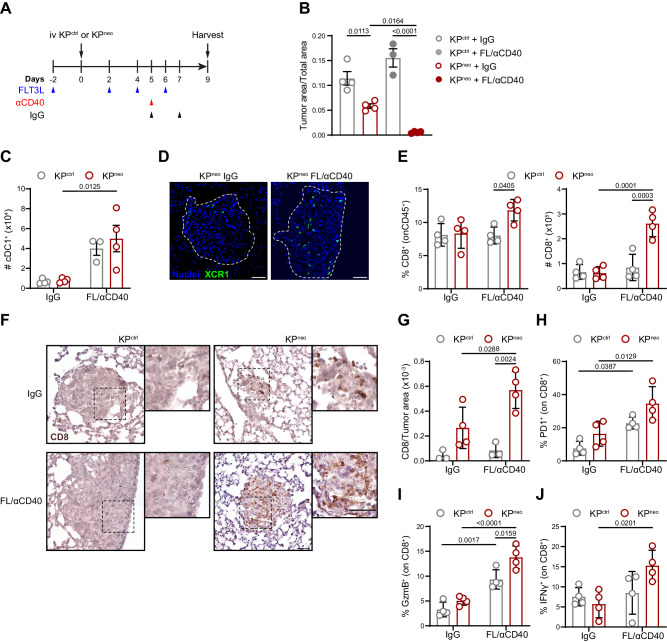
Fig. 5. FL/αCD40 therapy triggers CD8 T cell responses and tumor regression in KPneo lung orthotopic tumors.
A KPctrl and KPneo tumors were implanted orthotopically in the lung and treated as depicted in the scheme. B Quantification of tumor burden 9 days after tumor challenge. Tumor burden was calculated as the ratio between tumor nodules and total lung area (n = 4). C Absolute numbers of cDC1 in tumor-bearing lungs with KPctrl or KPneo tumors upon FL/αCD40 or IgG quantified by FC (n = 4). D Representative tissue cryosections showing localization of cDC1 within KPneo tumor nodules (dotted lines) in XCR1-Venus mice. Representative images from one out of four animals per group, from one independent experiment out of three performed. Scale bars represent 50 µm. E Frequencies (left) and absolute numbers (right) of CD8 T cells in lung tissues were quantified by FC (n = 4). F Representative IHC images of lung tissues labeled with anti-CD8 antibodies, from one out of four animals per group, from one independent experiment out of three performed. Insets depict CD8 T cells infiltrating tumor nodules. Scale bars represent 50 µm. G Quantification of the number of CD8+ cells infiltrating lung nodules showed in (F) (n = 4). H, I Relative frequencies of PD1+ CD8+ T cells (H) and granzyme B (GzmB)-producing CD8 T cells (I) in lungs of animals carrying KPctrl or KPneo tumors, treated with therapy or IgG (n = 4). J Relative frequencies of IFN-γ-producing CD8 T cells in the lungs of the indicated groups were measured after ex-vivo restimulation and ICS (n = 4). Two-way ANOVA followed by Tukey’s post-test in (B, E, G, H, I, J); or Sidak’s post-test in (C). All data are plotted as mean ± SEM, and represent one out of two independent experiments. Source data are provided as a Source Data File.

