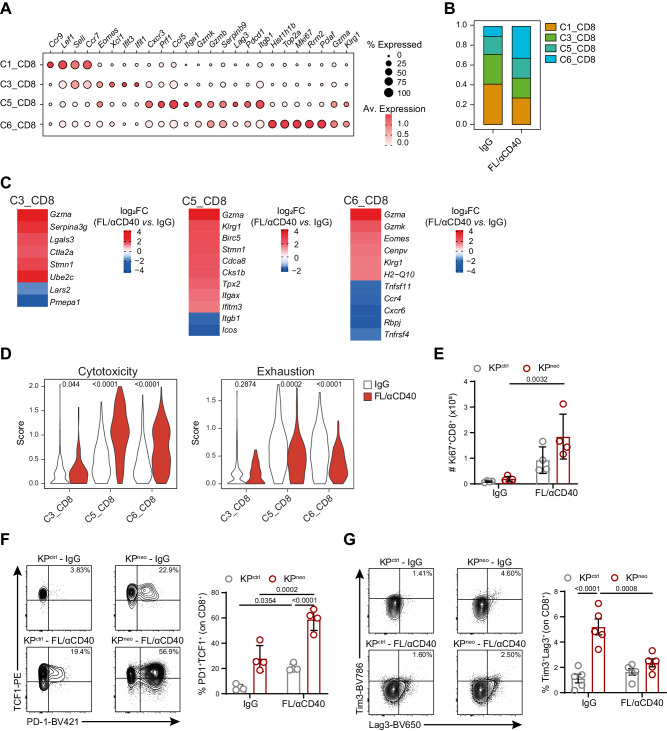
Fig. 6. DC therapy relieves exhaustion of CD8+ T cells in lung orthotopic tumors.
Mice were implanted with orthotopic KPneo tumors and treated with FL/αCD40 or IgG, CD45+ cells were isolated from the lungs at day 9 post-tumor challenge and subjected to scRNA-seq. A Dot plot showing scaled gene expression of selected genes defining CD8+ T clusters. B Proportion of CD8 T-cell clusters. C Heatmaps showing log2FC of selected differentially expressed genes (DEG) in FL/αCD40 vs. IgG in C3, C5 and C6 clusters (average log2FC FL/αCD40 vs. IgG FDR < 0.01). D Violin plots show combined mean expression values for the indicated genes (score) for the cytotoxic T cell markers (Gzma, Gzmb, Prf1, Tnf, Ifnγ, Cxcr6) or exhaustion markers (Pdcd1, Ctla4, Tigit, Lag3, Havcr2, Tox, Nrp1) in cells of the indicated clusters in FL/αCD40 vs. IgG. A–D scRNAseq data correspond to a pool of 4 animals per group. E Absolute numbers of Ki67+ CD8 T cells evaluated by ICS on KPctrl- and KPneo-bearing lungs (n = 4). F, G Representative FC plots and quantification of the frequencies of TCF-1+PD-1+ (F, n = 4 mice) and Tim3+Lag3+ (G, n = 5 mice) CD8+ T cells. Two-way ANOVA followed by Tukey’s post-test in (E, F, G); two-tailed Mann-Whitney U test in (D). Data are plotted as mean ± SEM, E–G represent one out of two independent experiments.

