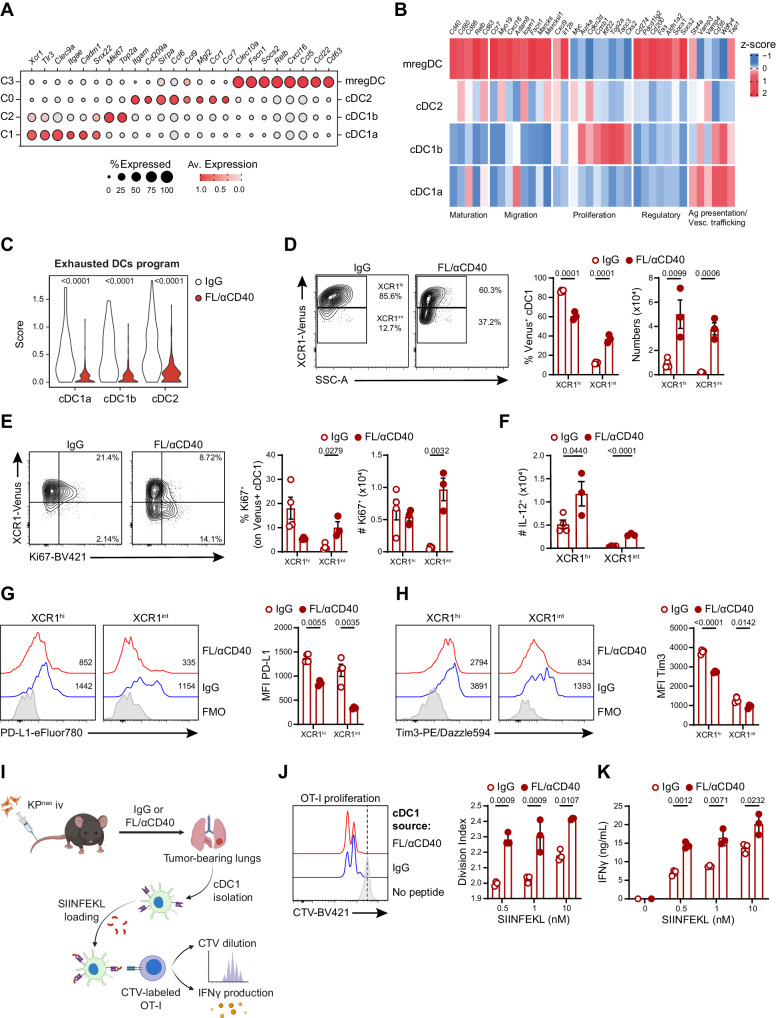
Fig. 7. DC-therapy induces expansion and functional rescue of cross-presenting cDC1 in lung tissues.
KPneo tumors were implanted orthotopically in the lung and treated with FL/αCD40 or IgG as depicted in 5 A. CD45+ cells were isolated at day 9 after tumor challenge and analyzed by scRNA-seq. A Dot plot showing scaled gene expression of selected genes defining DC clusters. B Heatmap showing the normalized expression of selected genes across different DCs clusters and the association of individual genes to the indicated processes. C Violin plots show combined mean expression values for the indicated genes (score) for the exhaustion markers (Axl, Ccl19, Ccl22, Aldh1) in cells of the indicated clusters in FL/αCD40 vs. IgG. A–C scRNAseq data correspond to a pool of 4 animals per group. D Representative FC plots and quantification of the frequencies and absolute numbers of Venus+ cDC1 cells. E Representative FC plots and quantification of the frequencies and absolute numbers of Ki67+ cDC1 cells. F Absolute numbers of IL-12+ cDC1 cells in KPneo treated with FL/αCD40 or IgG. G, H Representative histograms and quantification of PD-L1 or Tim3 expression in cDC1 subsets, respectively. D–H For IgG group n = 4 mice, for FL/αCD40 n = 3 mice, one out of two independent experiments. I Scheme describing cross-presentation assay, where sorted cDC1 from KPneo tumor-bearing lungs were pulsed with SIINFEKL ex vivo and co-cultured with CTV-labeled OT-I T cells (Created with BioRender.com). J Representative histograms and quantification of OT-I proliferation. K IFN-γ production by OT-I after 48 h of co-culture. J, K n = 3, data represent experimental replicates from pooled sorted cDC1 from 3 mice per group, per experiment, one out of two independent experiments. two-tailed Mann-Whitney U test in (C); two-tailed Multiple t tests in (D–K). Data are plotted as mean ± SEM, represent one out of two independent experiments.

