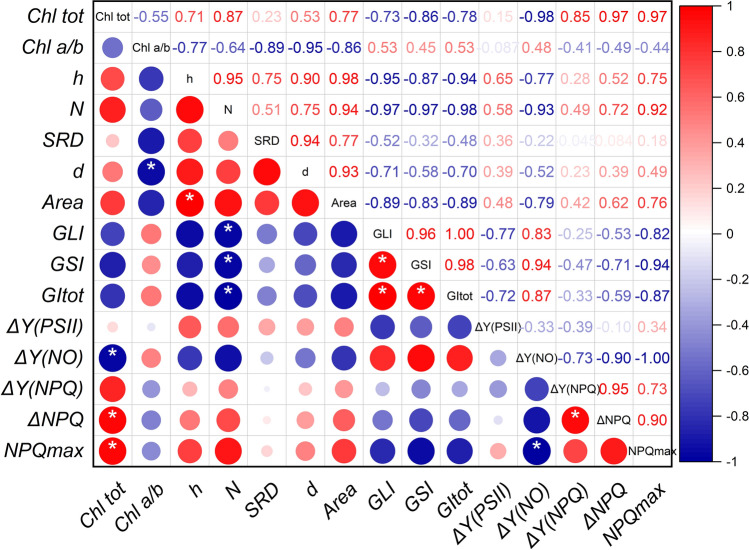
Fig. 7.
Matrix of Pearson’s r correlation coefficients of ultrastructural and photosynthetic parameters in bread and durum wheat lines. The values of Δ(RLC-LC) were sampled at irradiance of ca. 300 μmol photons m−2 s−1; NPQmax values at 1500 μmol photons m−2 s−1 at the end of LC. For the chlorophyll and fluorometric parameters, the averages were used, and for the morphometric parameters, the medians, except N, for which the average was used. Intense red color marks significant positive correlations, intense blue the negative, according to the scale on the right. The r values are also reported and the asterisk marks the statistically significant correlations with P < 0.05

