Fig. 1.
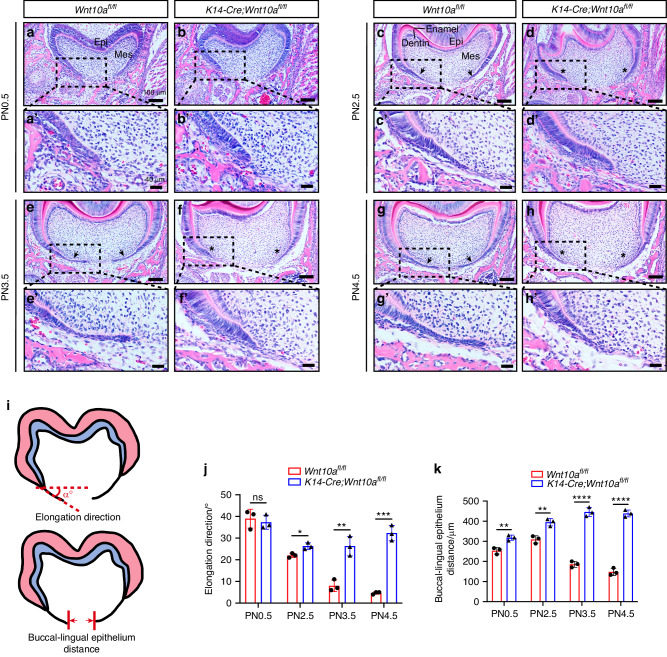
Comparison of tooth furcation histology during early stage postnatal root development of the mandibular first molar. a–h Coronal images of H&E-stained mandibular first molars (M1) from Wnt10afl/fl and K14-Cre;Wnt10afl/fl mice at PN0.5, PN2.5, PN3.5, and PN4.5. Black arrows indicate HERS formation in Wnt10afl/fl mice, and black asterisks indicate developmental failure of the furcation region in K14-Cre;Wnt10afl/fl mice. Epi, epithelium; Mes, mesenchyme. Scale bars: 100 μm. a’–h’ Higher magnifications of the lingual furcation region. Scale bars: 40 μm. i Schematic diagrams of measuring methods of the elongation direction and the buccal-lingual epithelium distance. j, k Bar graphs depicting HERS elongation direction (j), and buccal-lingual distance (k) in Wnt10afl/fl and K14-Cre;Wnt10afl/fl mice. n = 3 per group. Data are presented as mean ± SD. ns not significant, *P < 0.05, **P < 0.01, ***P < 0.001, ****P < 0.000 1

