Fig. 3.
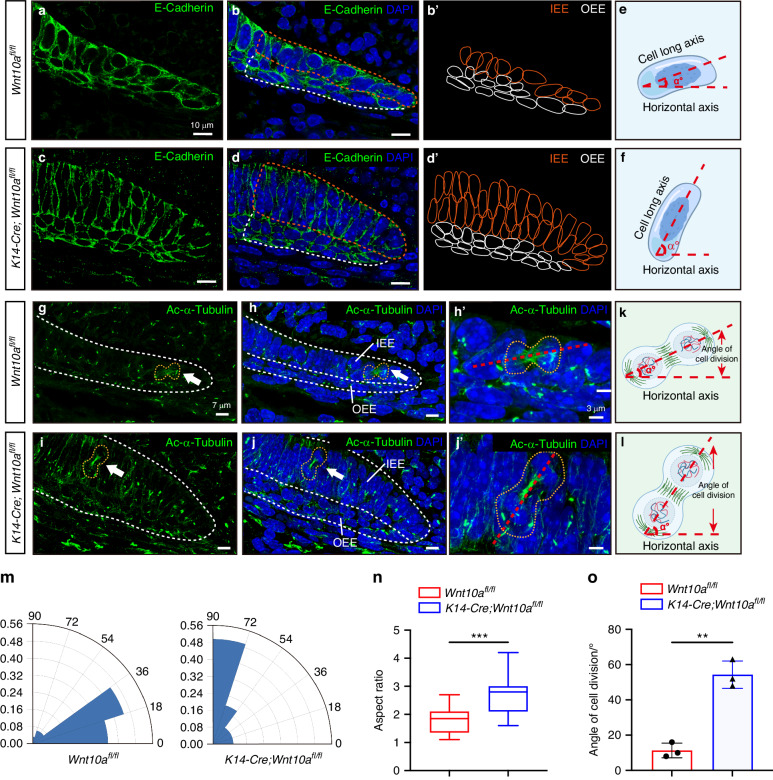
Altered cell long axis and misoriented cell division of IEE cells in K14-Cre;Wnt10afl/fl mice. a–d Co-localization of anti-E-cadherin (green) and DAPI (blue) shows the morphology of HERS cells in the lingual side of the root furcation region of M1 from Wnt10afl/fl and K14-Cre;Wnt10afl/fl mice at PN2.5. Orange and white dashed lines outline the IEE and OEE cells, respectively. Scale bars: 10 μm. b’, d’ Diagrams of IEE and OEE cell shapes in M1 from Wnt10afl/fl (b’) and K14-Cre;Wnt10afl/fl mice (d’), based on the staining results in (a–d). e, f Schematic diagrams of α angle measurement between cell long and horizontal axes. g–j Co-localization of anti-Ac-α-Tubulin (green) and DAPI (blue) shows IEE cell division direction in the root furcation region of M1 from Wnt10afl/fl and K14-Cre;Wnt10afl/fl mice at PN2.5. White dashed lines outline the IEE and OEE cells. The orange dashed lines outline the dividing IEE cells. Scale bars: 7 μm. h’, j’ Higher magnifications of the cells marked by orange dashed lines in (h) and (j). Red dashed lines indicate the division direction. Scale bars: 3 μm. k, l Schematic diagrams of the α angle between the direction of cell division and the measured horizontal axis. m Radial histogram quantification of the α angle between the cell long and horizontal axes based on (b’, d’). n Quantification of the aspect ratio of IEE cells in (b’, d’). o Quantification analysis of the α angle based on (h’, j’). n = 3 per group. Data are presented as mean ± SD. ns not significant, **P < 0.01, ***P < 0.001

