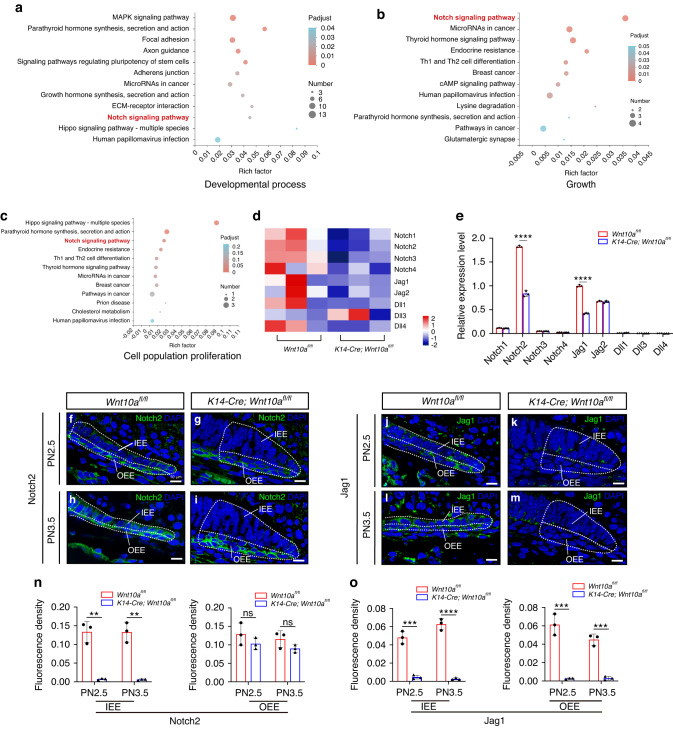
Fig. 4.
Loss of epithelial Wnt10a compromises Notch signaling in IEE cells. a–c Bubble maps of the KEGG pathway enrichment analysis for differentially expressed gene sets, including developmental process, growth, and cell population proliferation. The size of the bubbles represents the number of differentially expressed genes, and the color shade depends on the adjusted P-value of each term. Bold red font indicates the Notch signaling pathway. d Heatmap showing the relative expression levels of critical ligands and receptors in the Notch signaling pathway of the M1 dental epithelium from Wnt10afl/fl and K14-Cre;Wnt10afl/fl mice at PN2.5. e RT-qPCR results for critical ligands and receptors in the Notch signaling pathway in the M1 dental epithelium of Wnt10afl/fl and K14-Cre;Wnt10afl/fl mice at PN2.5. Jag1 expression in Wnt10afl/fl samples was set to 1. n = 3 per group. f–i Super-resolution imaging analysis of Notch2 expression patterns in dental epithelium within the lingual furcation region at PN2.5 and PN3.5. White dashed lines outline IEE and OEE cells in the root furcation region. Scale bars: 10μm. j–m Super-resolution imaging analysis of Jag1 expression patterns in dental epithelium within the lingual furcation region at PN2.5 and PN3.5. White dashed lines outline IEE and OEE cells in the root furcation region. Scale bars: 10 μm. n, o Fluorescence density analysis of Notch2 (n) and Jag1 (o) in IEE or OEE cells in (f–m). n = 3 per group. Data are presented as mean ± SD. ns not significant, **P < 0.01, ***P < 0.001, ****P < 0.000 1

