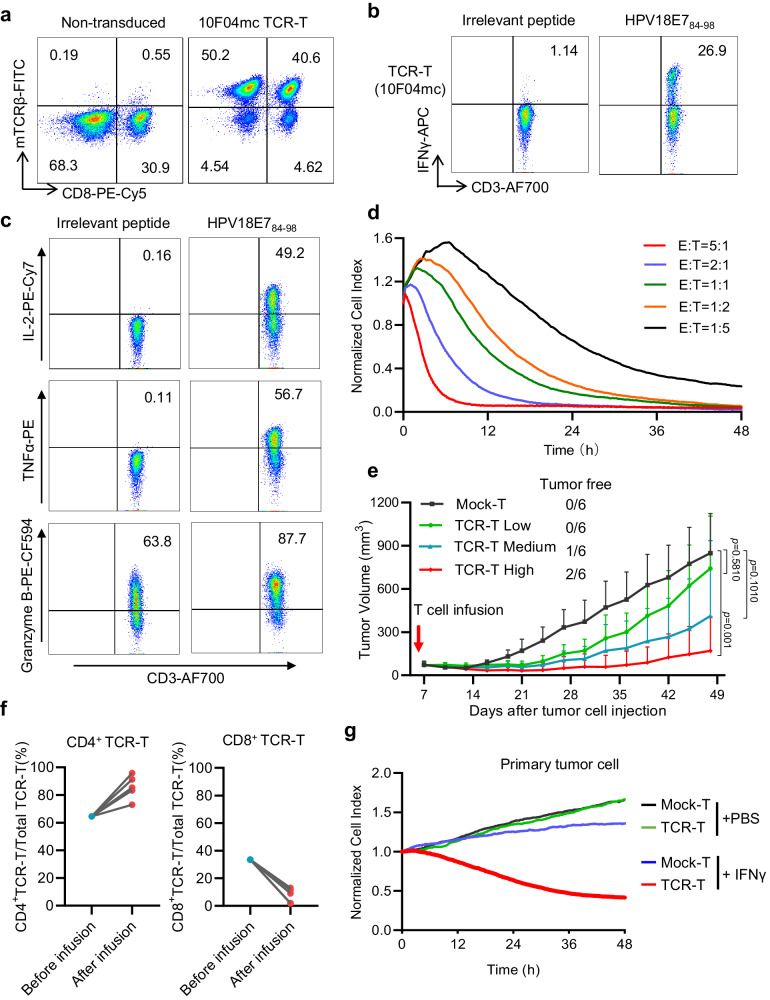
Fig. 3. 10F04mc TCR-T displays superior antitumor potency in vitro and in vivo.
a Healthy donor-derived PBMCs were activated and transduced with constant region murinized and codon-optimized TCR (10F04mc). The TCR expression was assessed using flow cytometry with an anti-mouse TCRβ antibody. b K562-DRA/DRB1*09:01 cells were pulsed with HPV18E784-98 or irrelevant peptide and co-cultured with 10F04mc TCR-T cells. Intracellular IFNγ production of which was analyzed by flow cytometry assay. c Intracellular TNFα, IL-2, and Granzyme B production were analyzed similarly as described in (b). d The in vitro killing capability of 10F04mc transduced T cells was evaluated in different effector-to-target (E:T) ratios (from 1:5 to 5:1) by Real-Time Cell Analyzer, while HeLa-DR0901 cells were used as the target cells. e NOG mice were injected subcutaneously with 4 × 10⁶ HeLa-DR0901-HPV18E7 cells per mouse at day 1. TCR-T groups received a single intravenous injection at a different dose (Low: 1 × 10⁷, medium: 3 × 10⁷, High: 5 × 10⁷ 10F04mc TCR transduced T cells per mouse, respectively) 6 days after the tumor cells injection. Control group mice received 5 × 10⁷ Mock-T cells at the same day. The tumor volume was measured by digital caliper every 2–5 days. Mice were euthanized at day 48. Murine splenocytes of the high dose TCR-T treated mice (after infusion) and original TCR-T cells (before infusion) were analyzed by flow cytometry (f). g Primary cervical cancer cells were isolated from the surgical specimens of DRA/DRB1*0901+cervical cancer patients and induced by IFNγ for 48 h in vitro. Next, primary cells were co-cultured with 10F04mc TCR-T cells (E:T = 2:1) for the cytotoxicity assay by the RTCA system. PBS treated primary cervical cancer cells and Mock-T cells were set up as negative controls. Data are representative of three independent experiments that resulted in similar results (a–d, g). Animal experiments were repeated twice under similar conditions with similar results (e, f). Data are shown as the mean + SD, n = 6 mice per group (e). For (f), n = 5 mice for after infusion groups. Statistical analysis was performed by two-tailed Student’s t test of the last measurement, with p < 0.05 considered significant (e). Source data are provided as a Source Data file.

