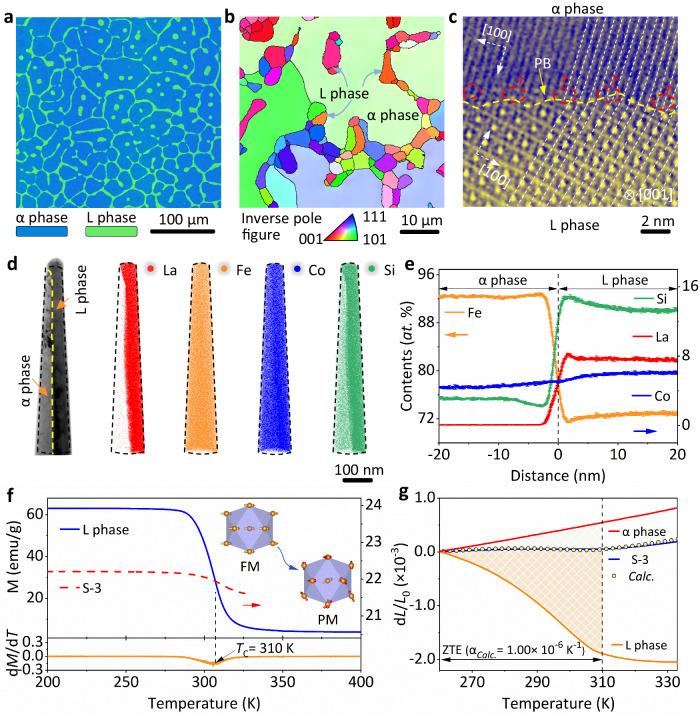
Fig. 2. The microstructure of the dual-phase alloys.
a Electro-probe micro-analyzer (EPMA) image of the S-3 alloy, L phase (green bar), and α phase (blue bar). b Electron back-scattered diffraction (EBSD) inverse pole map of the S-3 at high scales. c High-angle annular dark-field scanning TEM (HAADF-STEM) image of the corresponding phase interface along the [001]L zone axis. d Atom maps reconstructed using 3D-APT marked in nanoprobe with phase interface, α phase (left), and L phase (right). e One-dimensional concentration profile of the elemental distributions. The error bars represent the standard deviation. f Field-cooling (FC) magnetization (M) at a magnetic field of L phase (LaFe10.30Co0.83Si1.87, 1000 Oe) and S-3 (500 Oe), respectively. Insert the magnetic structure model from ferromagnetic order (FM) to paramagnetic transition (PM). The Curie temperature (TC) is determined by the dM/dT curve. g The dilatometer thermal expansion of S-3, LaFe10.30Co0.83Si1.87 (L phase), Fe92.42Co4.34Si3.07 (α phase) alloys. The calculated S-3 ZTE (empty circle point line) is derived from L-phase and α phase thermal expansions.

