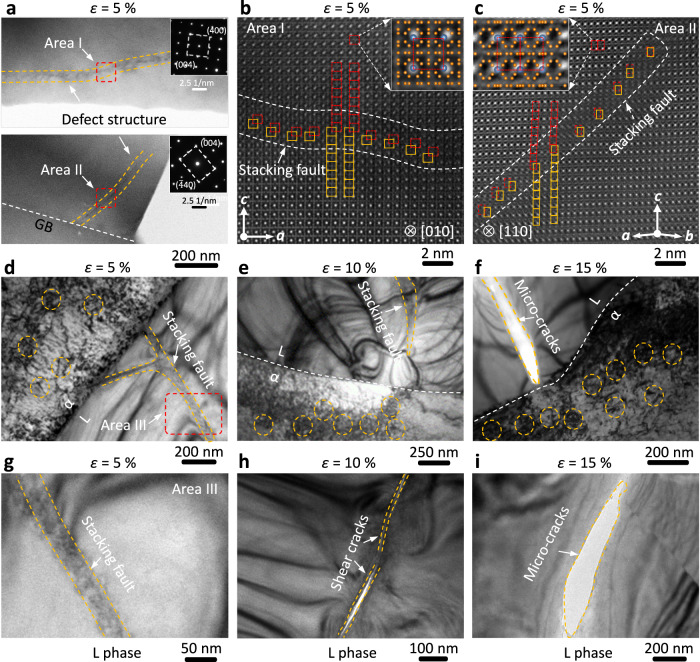
Fig. 4. Microstructural evolutions of the S-3 by TEM investigation.
a Defect structures in Area I and II of the L phase at ε = 5%. b, c HAADF-STEM images of two typical stacking faults in areas I and II. Inserted the structure model of the L phase along different [010] and [110] orientations. d–f Microstructure evolutions at phase interfaces under different strains (ε = 5%, 10%, and 15%). g–i Stacking faults evolutions in the L phase. Area III is marked by the red dashed box in (d). Noted: The structure of the cracks is affected to varying degrees by the thinning process.

