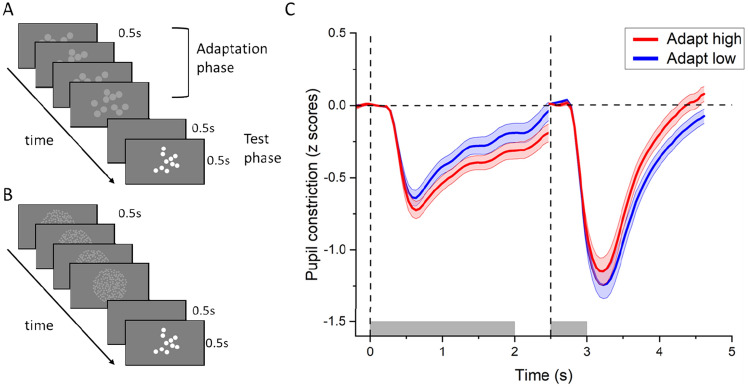
Figure 1.
Paradigm and stimuli. (A, B) Schematic representation of a trial in the adapt low (A) and adapt high (B) conditions. After the test stimulus presentation participants simply maintained gaze on the fixation point for another 2.5 s (pupillometry experiment) or verbally estimated the numerosity of the test stimulus (psychophysical experiment) before the following trial was presented. (C) Time courses of pupil size in response to the adapter and test stimuli during and after adaptation to high (160 dots, red curves) and low (10 dots, blue curves) numerosities. The vertical dashed lines and the gray shaded area on the abscissa define the onset and offset of the adapting and test stimulus. Thick lines show the pupil constriction averaged across participants and across test numerosities; the shaded area represents the SEM.

