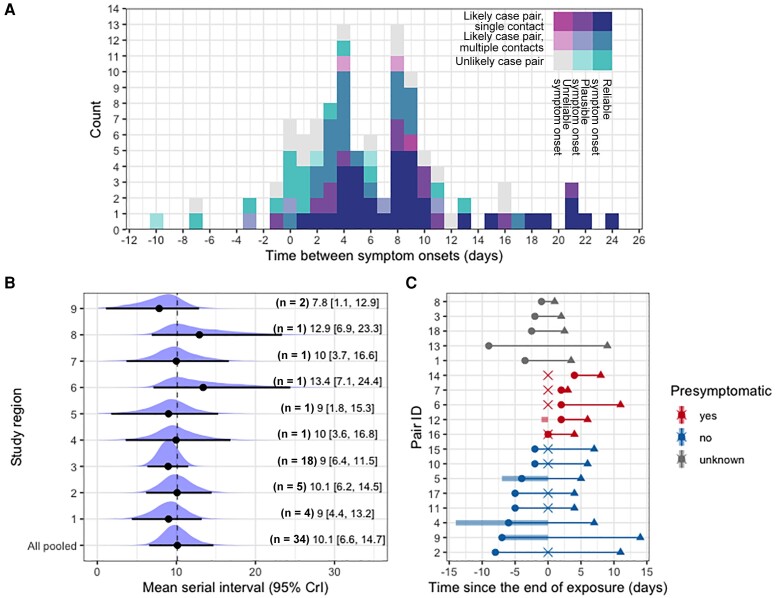
Figure 1.
Time scale of observed transmissions. A, Reported time differences between symptom onsets (n = 109). Colors show the reliability of reporting; the reliability of self-reported symptom onset dates was rated (unreliable, plausible, and reliable) and the likelihood of transmission between 2 cases was categorized (contact is unlikely, contact is likely and the most plausible one among several reported contacts, contact is likely and the only contact reported for the infectee). B, The pooled serial interval is estimated as the average duration between symptom onset dates of a pair, incorporating random effects specific for regional public health services. Black plots represent mean values of posterior distributions, and whiskers show the 95% credible intervals (CrIs). C, Transmission pairs notified by a single regional public health service (n = 18). Circles and triangles indicate symptom onset of infectors and infectees, and the cross-point is the exact date of exposure between the paired cases (if available). If the exposure date was reported as consecutive days, the time interval is visualized as a shaded bar.

