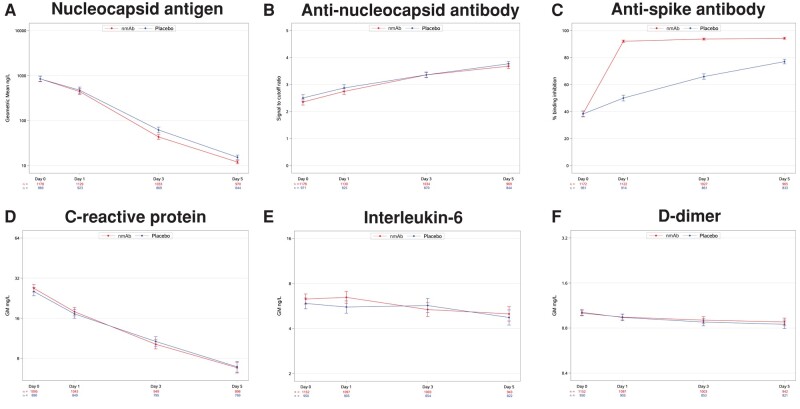
Figure 1.
Line plots of mean biomarker levels (with 95% confidence intervals) over time by neutralizing monoclonal antibody treatment and placebo groups. A, D, E, and F, Levels as geometric means; these biomarkers were analyzed on the log scale and back transformed. B and C, Levels as means analyzed on the original scale.

