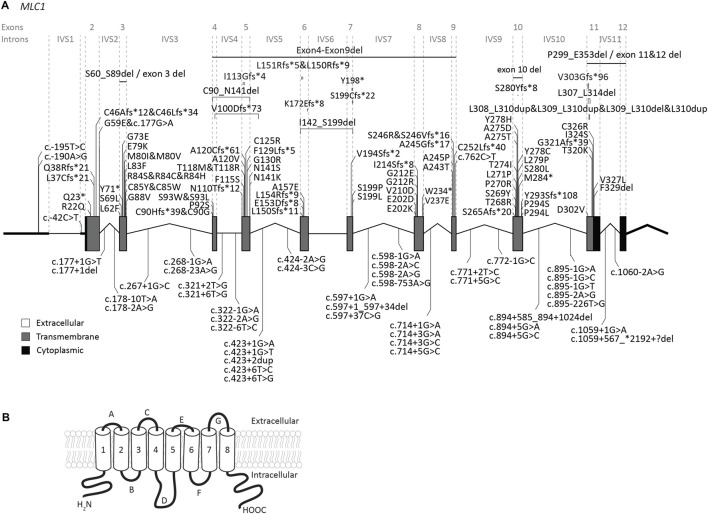
FIGURE 2.
An overview of MLC1 variants found in MLC patients. (A) MLC1 is depicted. Exonic regions are indicated by blocks; intronic regions by lines. Exonic regions and intronic regions depicted with a horizontal line are drawn to scale. All variants are indicated above or below the gene schematic. For exonic variants the resulting peptide alterations are indicated, for intronic variants coding DNA alterations are indicated. Exonic variants are depicted in their relative positions. Intronic variants are depicted in their relative position roughly in the first or second half of the respective intronic region. (B) Schematic image of MLC1 in the cell membrane.

