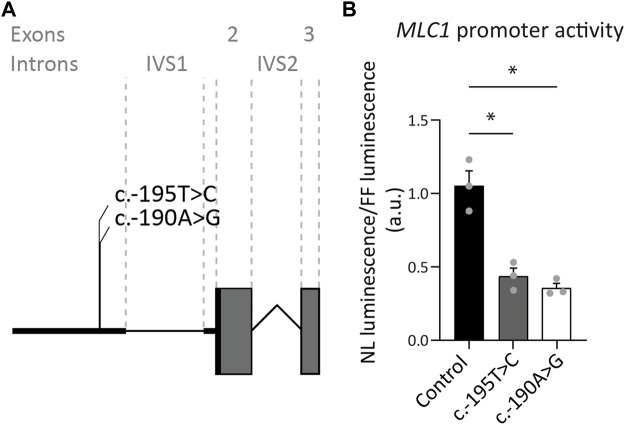
FIGURE 3.
Exon 1 variants affecting expression of the downstream reporter. (A) Miniature schematic of 2 variants in the promoter region of MLC1. (B) Reporter gene assay depicting MLC1 promoter and 5′UTR activity in U373 cells. Readout was the ratio of Nano luciferase luminescence over Firefly luciferase luminescence in arbitrary units (a.u.). Experiments were performed in triplicate (n = 3), and each data point represents the average of 4 technical replicates. Graph shows means and individual data points of one experiment. Both the c.-190A>G and c.-195T>C variants significantly reduced expression of the downstream open reading frame of the reporter, reflected in a decrease in luminescence over fluorescence ratio. Brown-Forsythe ANOVA; F = 30.63 (2.000, 3.543) p = 0.0058. Dunnett’s T3 multiple comparisons test Control vs. c.-190A>G t = 6.576 df = 2.392 p = 0.0364. Control vs c.-195T>C t = 5.363 df = 3.085 p = 0.0222. *,p < 0.05.

