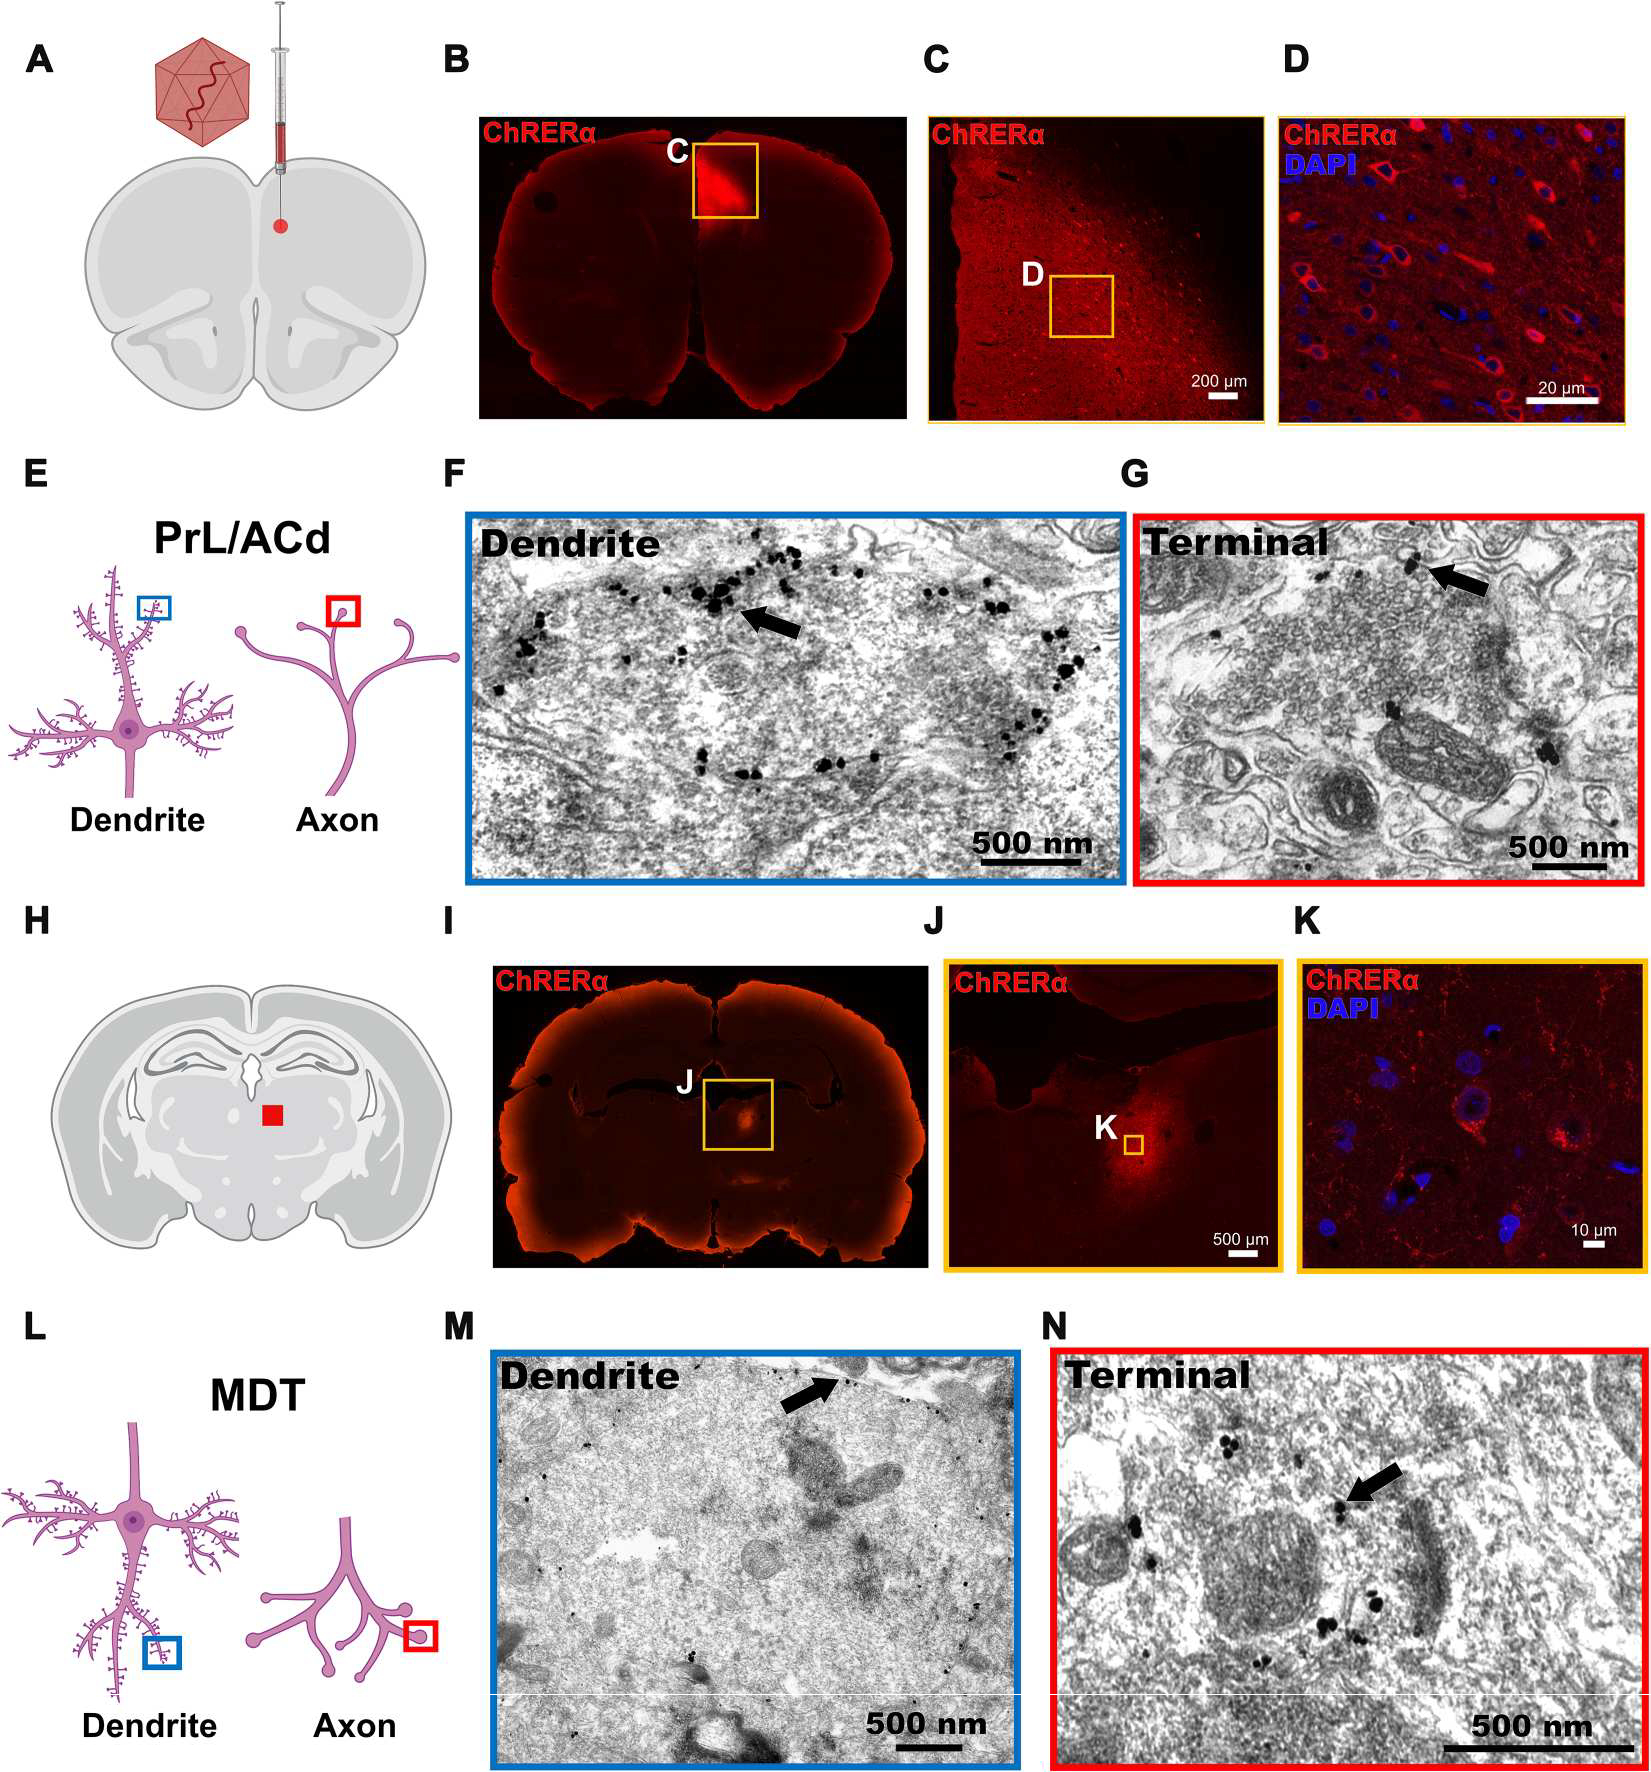
Fig. 2. ChRERα trafficking and subcellular localization in the rat brain.

(A) Illustration of the AAV-ChRERα injection site in the right PrL/ACd (AP = 3.0, ML = 0.6, DV = −3.5) is shown. (B to D) Representative IHC images at three different levels of magnifications illustrate the expression of ChRERα in cells in the right PrL/ACd (red = anti-ChR2 and blue = DAPI). (E) Schematic of dendrite (left, blue box) and axon terminal (right, red box) illustrates the localization of immuno-EM images. (F and G) Immunogold labeling of ChRERα expression in (F) right PrL/ACd dendrite and (G) axon terminal. (H) Schematic of right MDT projection site (red square). (I to K) Representative IHC images at three different levels of magnification illustrate the expression of ChRERα in cells in the right MDT (red = anti-ChR2 and blue = DAPI). (L) Schematic of dendrite localization (left, blue box) after retrograde transduction and anterograde axon terminal (right, red box) trafficking in the MDT. (M and N) Immunogold labeling of ChRERα expression in (M) MDT dendrite and (N) axon terminal.
