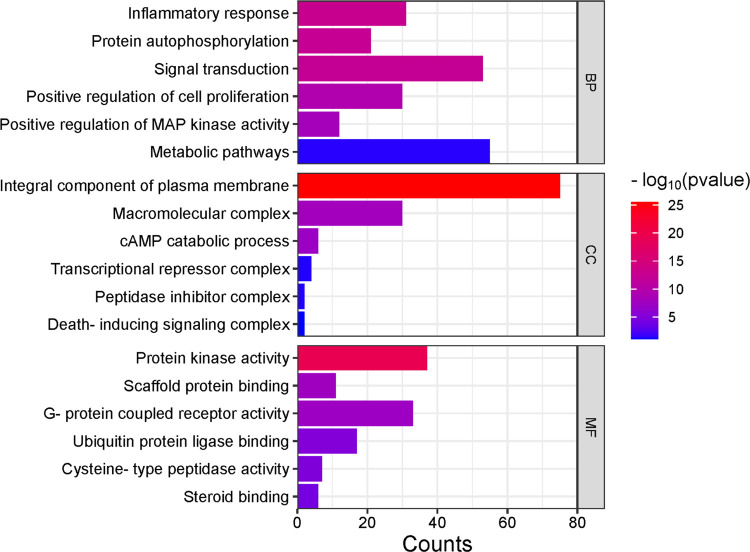
Figure 3.
Bar plot representing a comprehensive visualization of the Gene Ontology (GO) analysis results, categorizing enriched terms into biological processes (BPs), cellular components (CCs), and molecular functions (MFs). Color intensity reflects the log-transformed values, indicating the importance of specific terms within each category.

