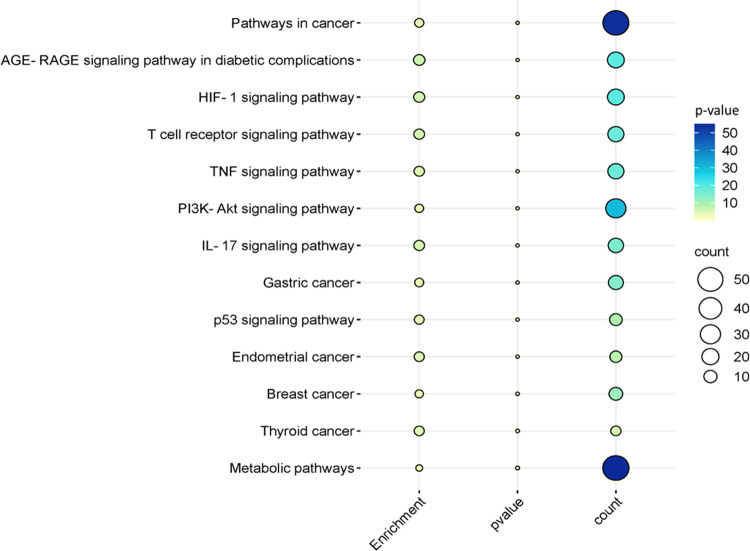
Figure 4.
Bubble plot illustrating significant KEGG pathways. Each bubble corresponds to a pathway, and the color of each bubble represents the p-value of that pathway. Larger and more colorful bubbles indicate the number of genes (counts) involved in specific pathways, signifying their increased significance.

