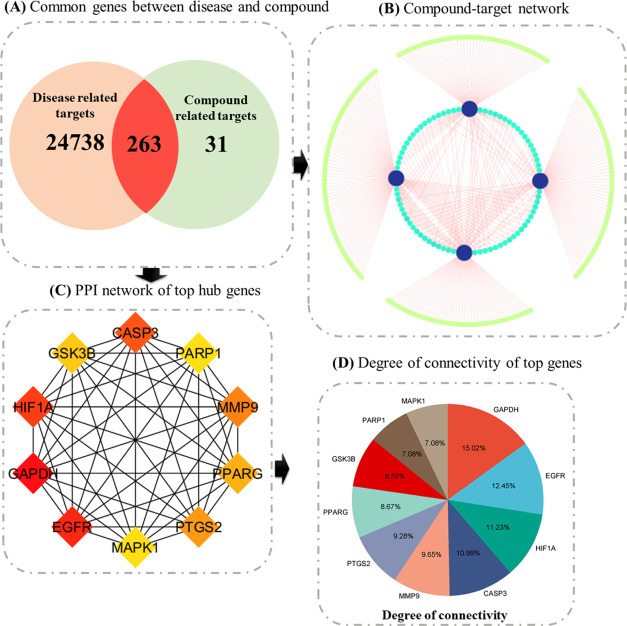
Figure 5.
Integrated analysis of target genes and compound interactions. (A) Venn plot: This panel displays a Venn plot showcasing the common genes shared between compound-related and disease-related targets, providing insights into potential overlaps. (B) Compound–Target Network: In this subfigure, nodes represent compounds and their associated proteins. Node size reflects the degree of connectivity, emphasizing key interactions within the network. (C) Top 10 Hub genes: This panel highlights the top 10 genes ranked based on the degree algorithm, underlining their significance in the network. (D) Hub gene degrees: Shown as a bar plot, this subfigure represents the degree of connectivity for each hub gene, providing a visual perspective on their importance within the network.

