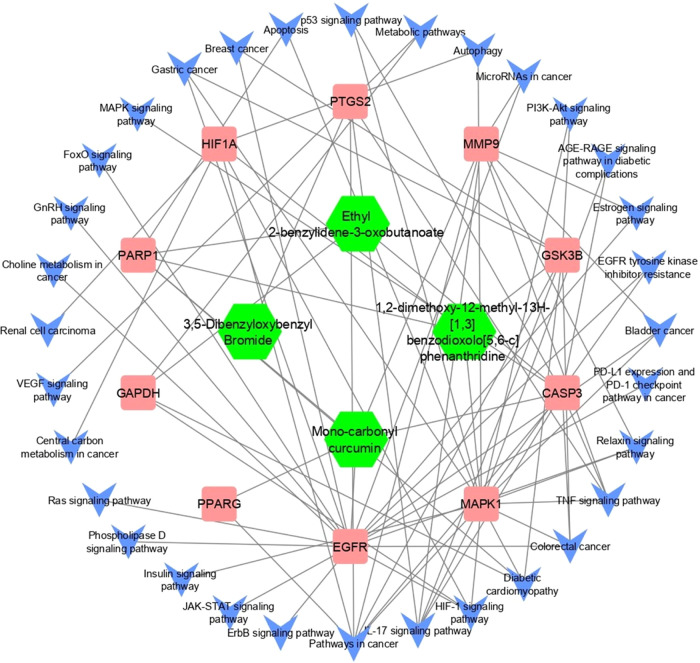
Figure 6.
Compound–target–disease network. In this schematic representation, hub proteins are symbolized by square shapes, targeted pathways are indicated by arrows, and active compounds are represented by hexagonal shapes. The connections and interactions among these elements reveal the intricate network of relationships underlying the impact of compounds on cancer.

