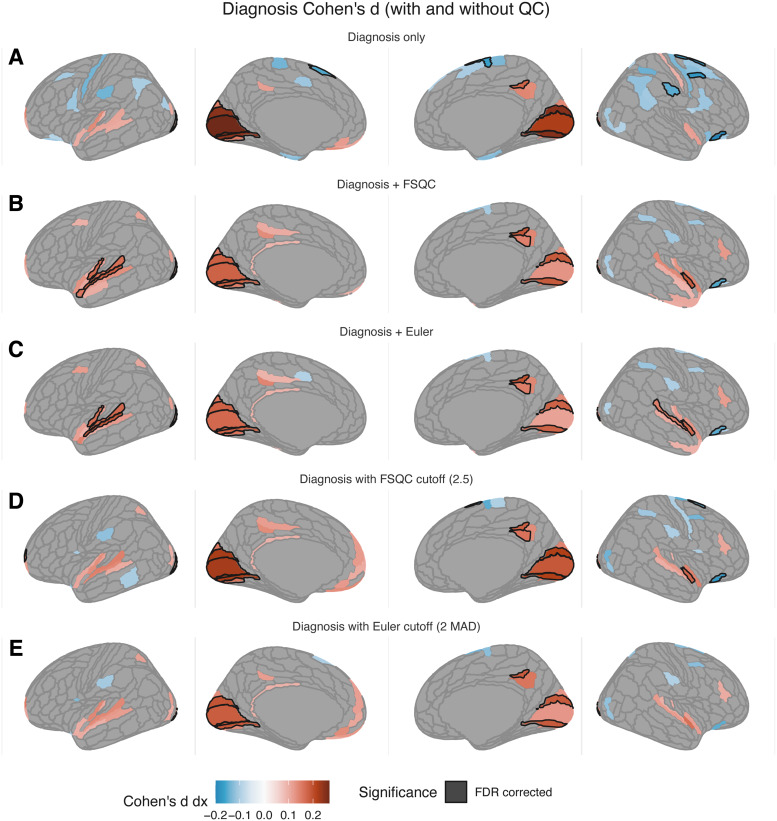
Fig. 5.
Impact of autism diagnosis on cortical thickness (Cohen’s d) without accounting for image quality (A), when controlling for FSQC (B) or Euler (C), and thresholding by FSQC (D) and Euler (E). Significant regions passing 5% FDR are shown with a black border; other regions are subthreshold (i.e., not surviving FDR) differences. Most results indicate thicker cortex in autism relative to controls; results do not change drastically with quality control, but most negative associations between diagnosis and CT (autism < controls) disappear. Significantly thicker cortex in the superior temporal gyrus, which has previously been reported in autism, is observed only when controlling for quality (FSQC or Euler).

