
Figure 6.
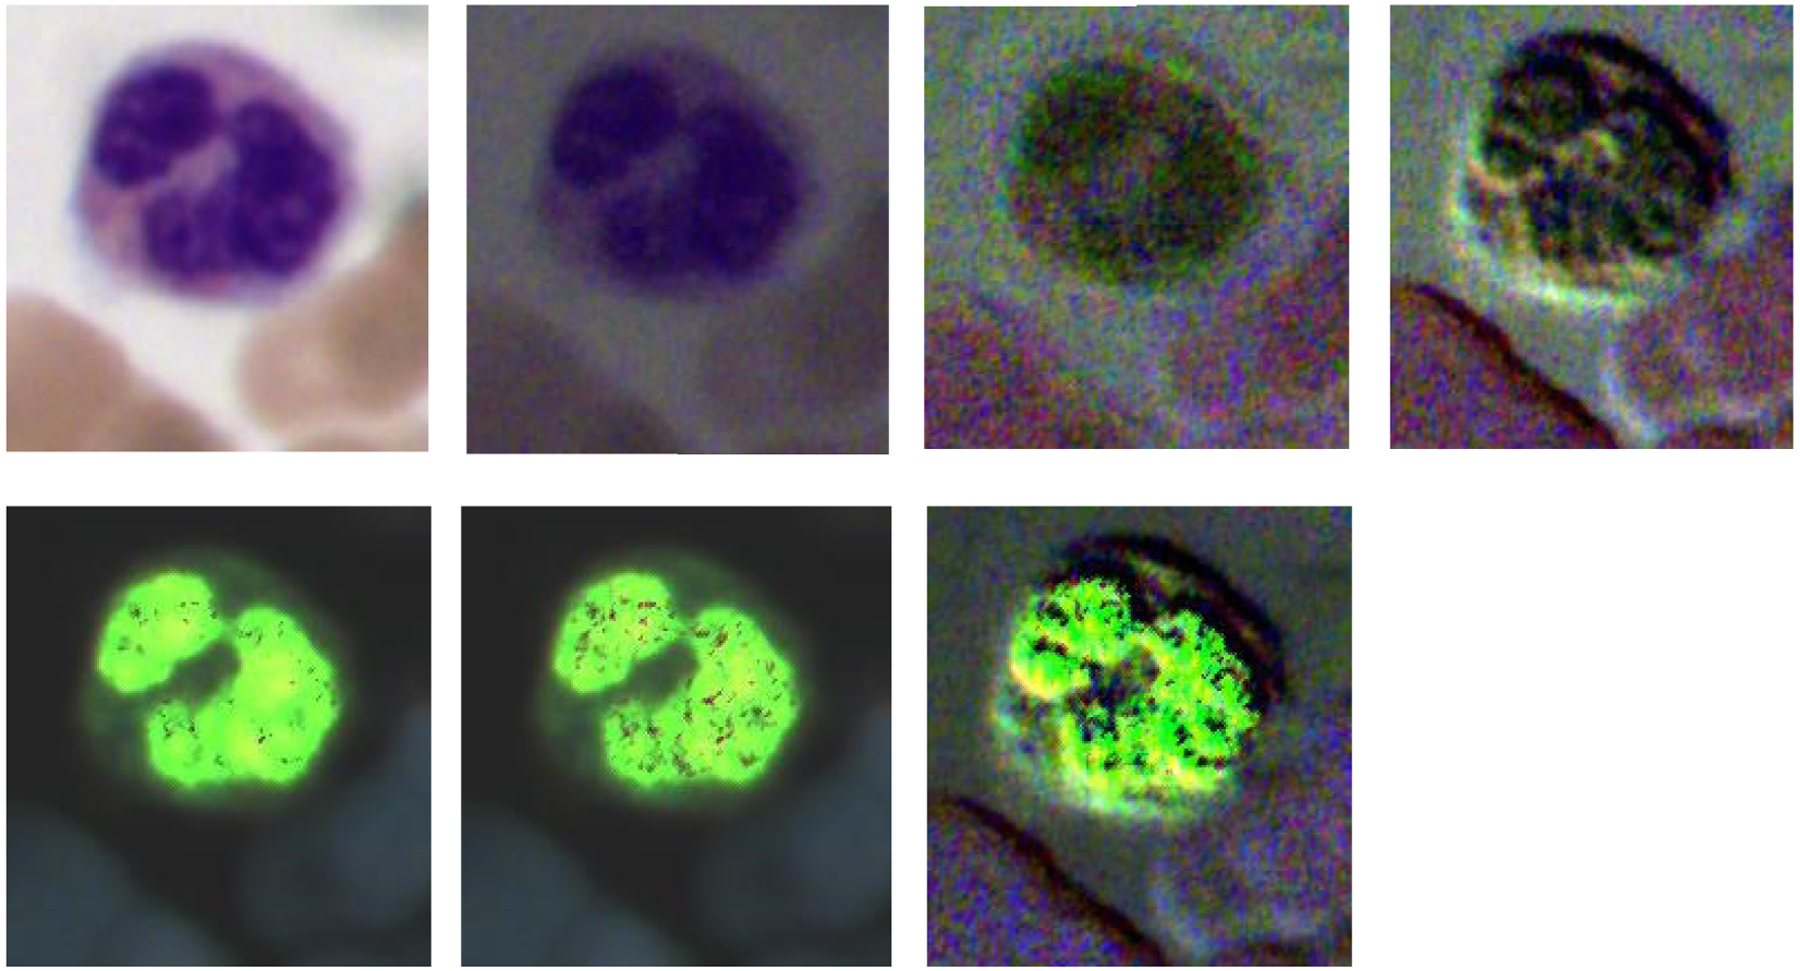
The four images on the top row (left to right) demonstrate the RGB images of Stokes vector parameters (S0, S1, S2, and S3) of a neutrophil on a Wright’s stained blood smear slide. The three images on the bottom row (left to right) demonstrate the RGB images of Stokes vector derived parameters (DOP, DOLP, and DOCP) of the neutrophil.