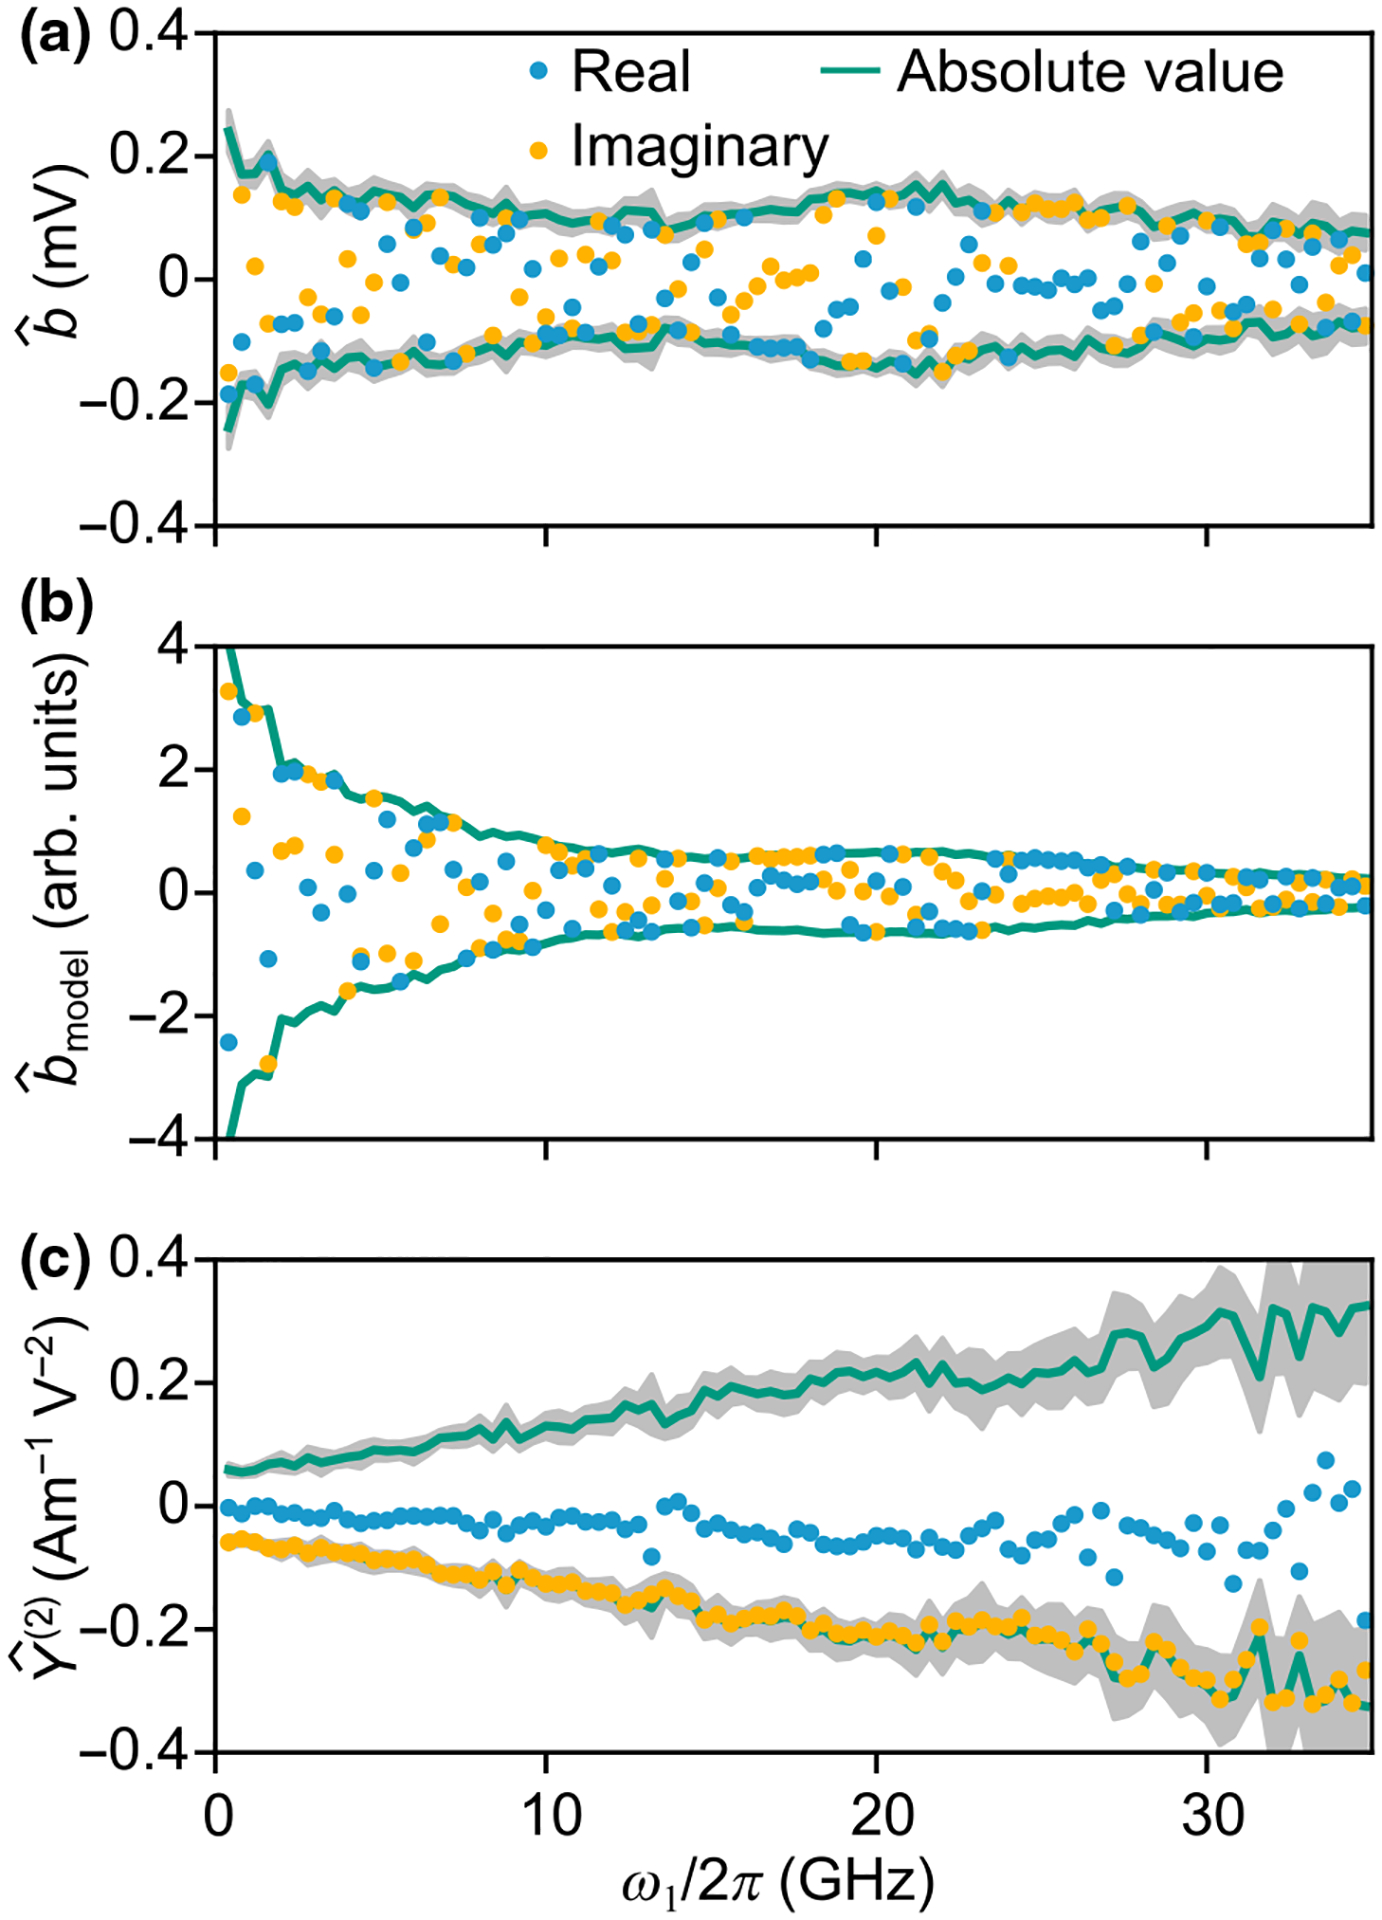
FIG. 6.

Example of the nonlinear admittance estimation from measurements. (a) Measured mixing product, of a CPW of length . (b) , the hypothetical value of the mixing product under the condition . The estimated uncertainty in (b) from uncertainty in is smaller than the width of the line. (c) estimated by . Error bars in (a) and (c) represent a 95% confidence interval estimated from the distribution of estimates from CPWs of different lengths. We omit error bars on individual data points for visual clarity.
