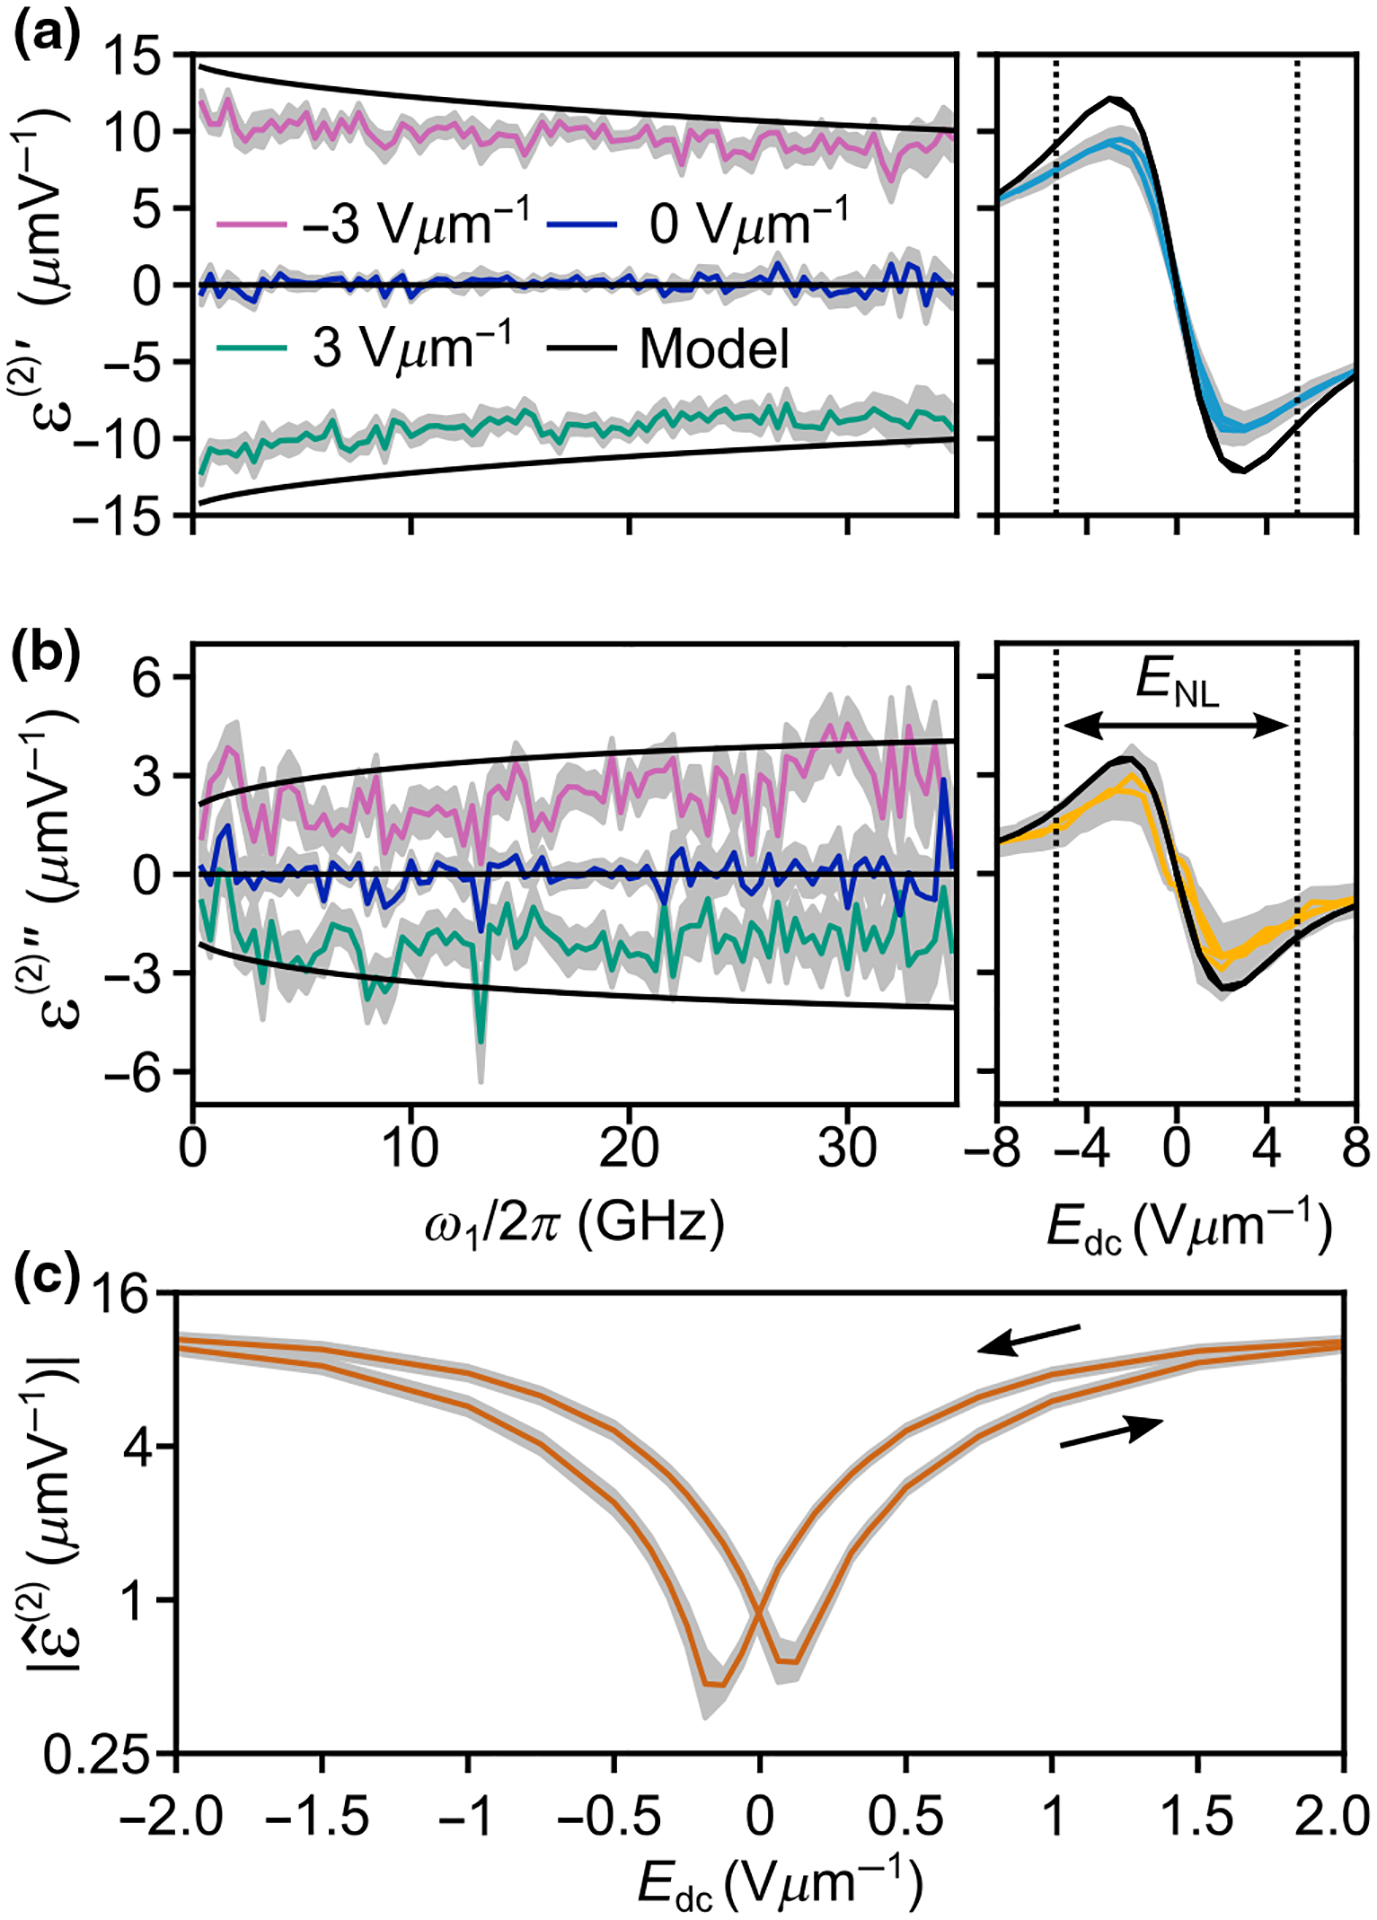
FIG. 8.

Second-order nonlinear permittivity, , inferred from the mixing product. In the frequency-dependent measurements, we vary the angular frequency of one of the stimulus signals, , while the other stimulus frequency, , is held constant at . In our bias-swept measurements we set and . To facilitate comparison to Fig. 7, we indicate an interval of width centered around the . The error bars (gray) are the 95% confidence interval from the standard error of the mean. (a) Real part, . (b) Imaginary part, . (c) Absolute value of near .
