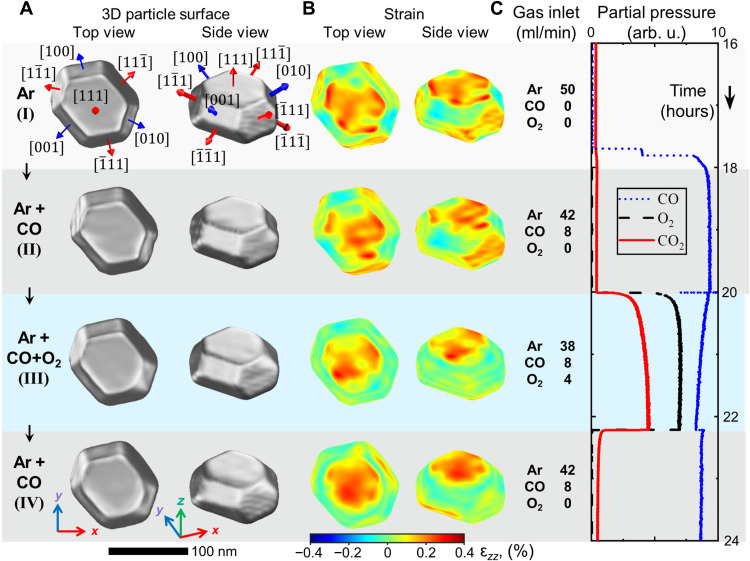
Fig. 2. Nanoparticle shape and surface strain for different gas conditions.
(A) Top and side views of the reconstructed nanoparticle and (B) strain field ϵzz at the nanoparticle surface for gas conditions (I to IV). The position of the surface is defined as a cut at 55% of the reconstructed crystalline electron density from its maximum value. (C) Inlet gas composition and mass spectrometer signal during the experiment: CO (blue), O2 (black), and CO2 (red).

