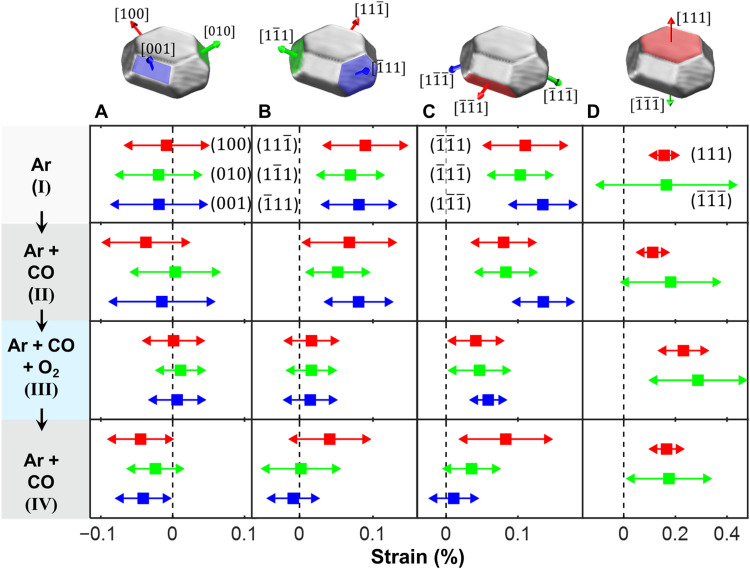
Fig. 3. Facet-resolved strain as a function of the reaction conditions.
(A) Top <100> type side facets, (B) top <111> type side facets, (C) bottom <111> type side facets, and (D) top (111) and bottom () facet. Mean strain values, squares; SD and standard deviation (SD), lines with arrows. The colors of the facets in (A) to (D) correspond to the color of the experimental strain values in the plots respective below.

