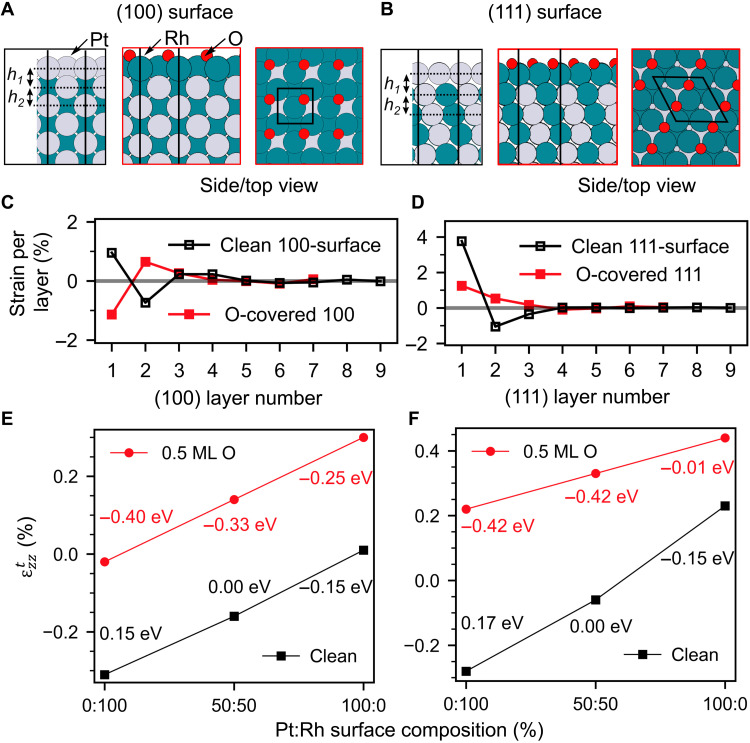
Fig. 4. Surface composition and oxygen coverage–dependent calculated surface strain.
(A and B) Side and top views of the clean and oxygen-covered (100) and (111) surfaces. (C and D) DFT surface strain profiles for the clean and 0.5 monolayer (ML) oxygen-covered (100) and (111) surface. (E and F) Trends in for the (100) and (111) surface as a function of the top layer Pt-Rh composition together with the surface energy difference per atom relative to the stoichiometric surface. Black squares, clean surface; red circles, 0.5 monolayer oxygen-covered surface.

