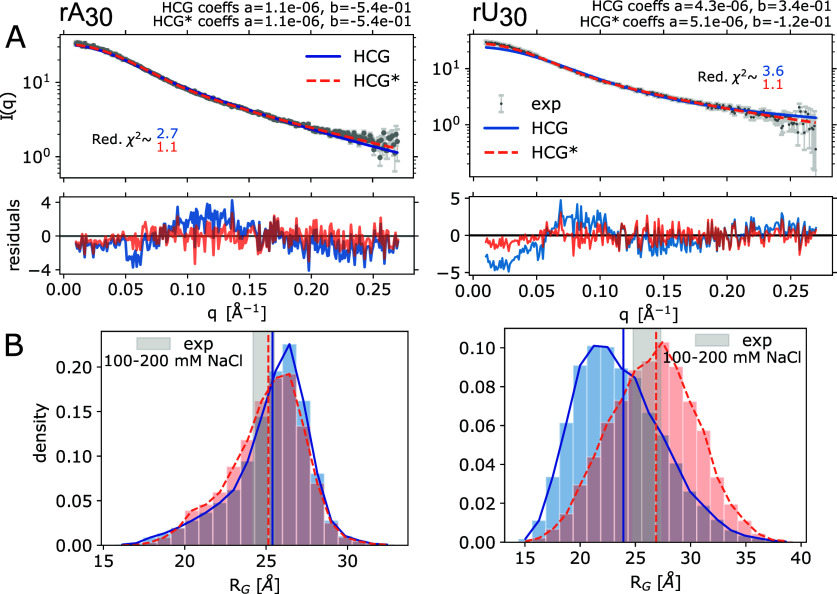
Figure 3.
Comparison of the rA30 and rU30 HCG structural ensemble to SAXS measurements18 (left and right columns, respectively). (A) Top: Experimental SAXS profiles measured at 100 mM NaCl in gray and the average profile calculated using Crysol64 for the unrefined HCG ensembles (blue), 10000 structures each, and the refined HCG* ensembles (orange) with weights for θ = 100 and θ = 46 for rA30 and rU30, respectively. Intensity scale factors a and background correction constants b determined by least-squares fitting are shown in the plots. Bottom: Residuals. (B) Distribution of RG in the unrefined HCG and reweighted HCG* ensembles (blue and orange, respectively). Vertical lines indicate the RMS RG value of the HCG ensemble (solid blue) and the weighted RMS RG value (HCG*, dotted orange). The gray shaded area highlights the area spanned by the RG value inferred from the SAXS profiles measured at 100 mM and 200 mM NaCl including the error range.

