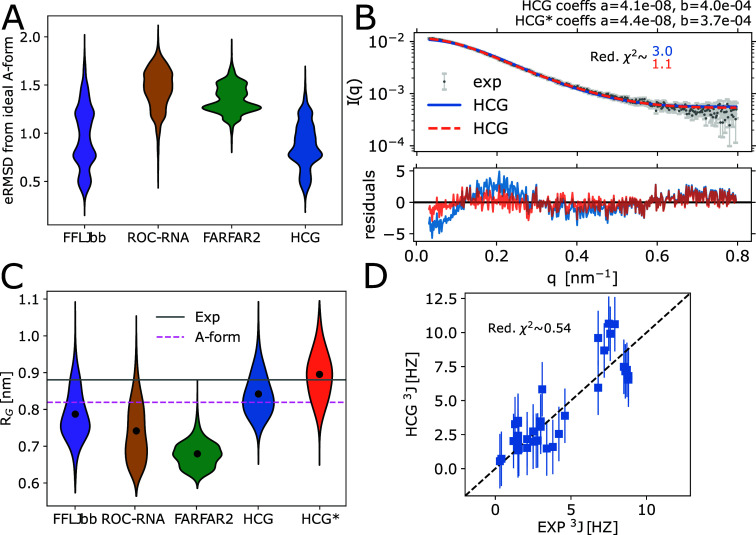
Figure 5.
Characterization of structural ensembles of heteropolymeric rUCAAUC sampled with MD and FARFAR2 from ref (14) and HCG. (A) Distribution of the eRMSD to ideal A-form. (B) Top: Average SAXS profile calculated for the HCG ensemble before (blue) and after ensemble refinement (HCG* with weights for θ = 100 in orange) fitted to the experimental profile14 (orange and gray, respectively). The intensity scale factors a and the background correction constants b as calculated by least-squares fitting are shown in the plot. Bottom: Residuals calculated for scattering profiles. (C) Distribution of RG values in sampled ensembles, the refined HCG* ensemble, experimental average as determined from SAXS, and for typical A-form. (D) Correlation plot of experimentally measured 3J couplings of the backbone and sugar moiety66 and calculated values for HCG. Vertical bars indicate the estimated uncertainty of ±2 Hz (one standard error) in calculating the 3J-couplings from RNA structures using approximate Karplus relations.13,66

